Irregular astigmatism, often seen in corneal ectasia, can cause significant visual distortion in patients. The most common primary ectasia—keratoconus—presents challenges for eye care providers and patients alike.1 To help meet these challenges head-on, wavefront aberrometry, corneal topography and medical imaging (e.g., pupillometry) have proven effective in the early detection and management of corneal ectasia, especially keratoconus. In addition to increasing our knowledge of refractive error, these technologies allow doctors to better understand the pathophysiology of different conditions and how to improve patient outcomes with specialty contact lenses. Accumulating patient data with these instruments may also give us an opportunity to learn more about the prevalence and impact of certain conditions.
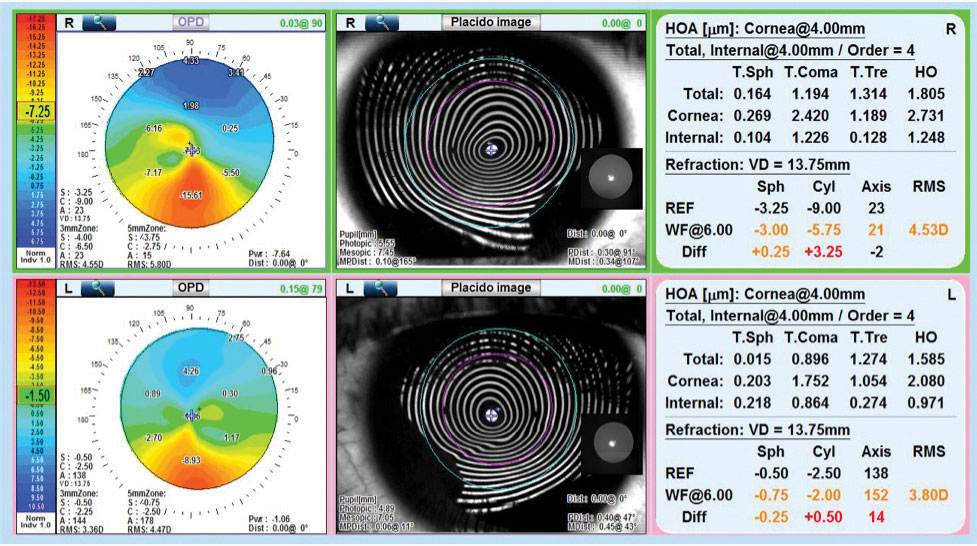 |
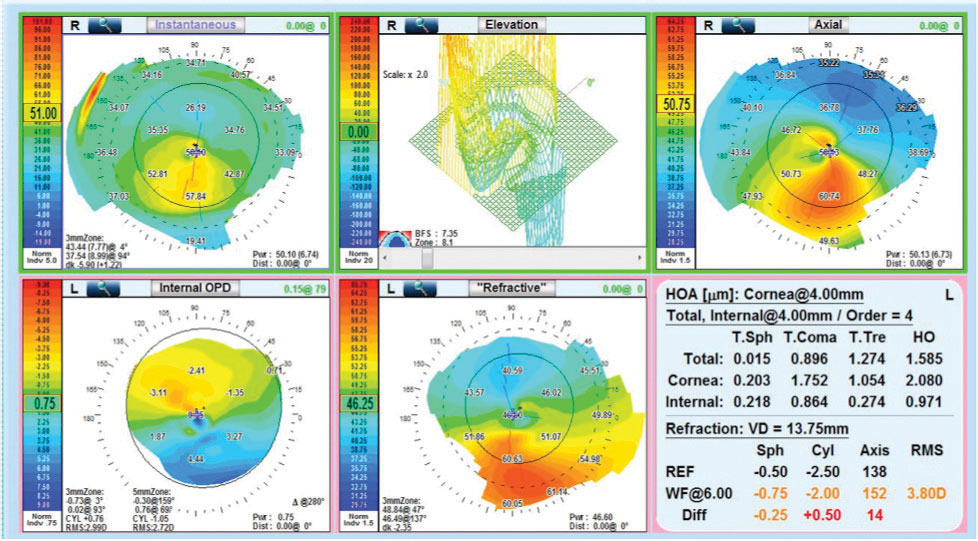
| OPD aberrometry of the right and left eyes shows inferior steepening consistent with keratoconus. Placido disc imaging shows distortion of the mires consistent with primary corneal ectasia. HOAs with large amounts of corneal and internal coma are present, representing aberrations that extend to the posterior cornea. |
This article, adapted from a SpecialEyes blog post, discusses the benefits of modern wavefront aberrometry.2 This powerful tool can aid in detecting and managing many corneal conditions as well as in evaluating patients for soft multifocal contact lenses to relieve them of the challenges they face living with associated diseases.
Note: one of the authors has an industry affiliation and will be using a particular product to illustrate various concepts, but the advice is often broadly applicable using other technologies as well.
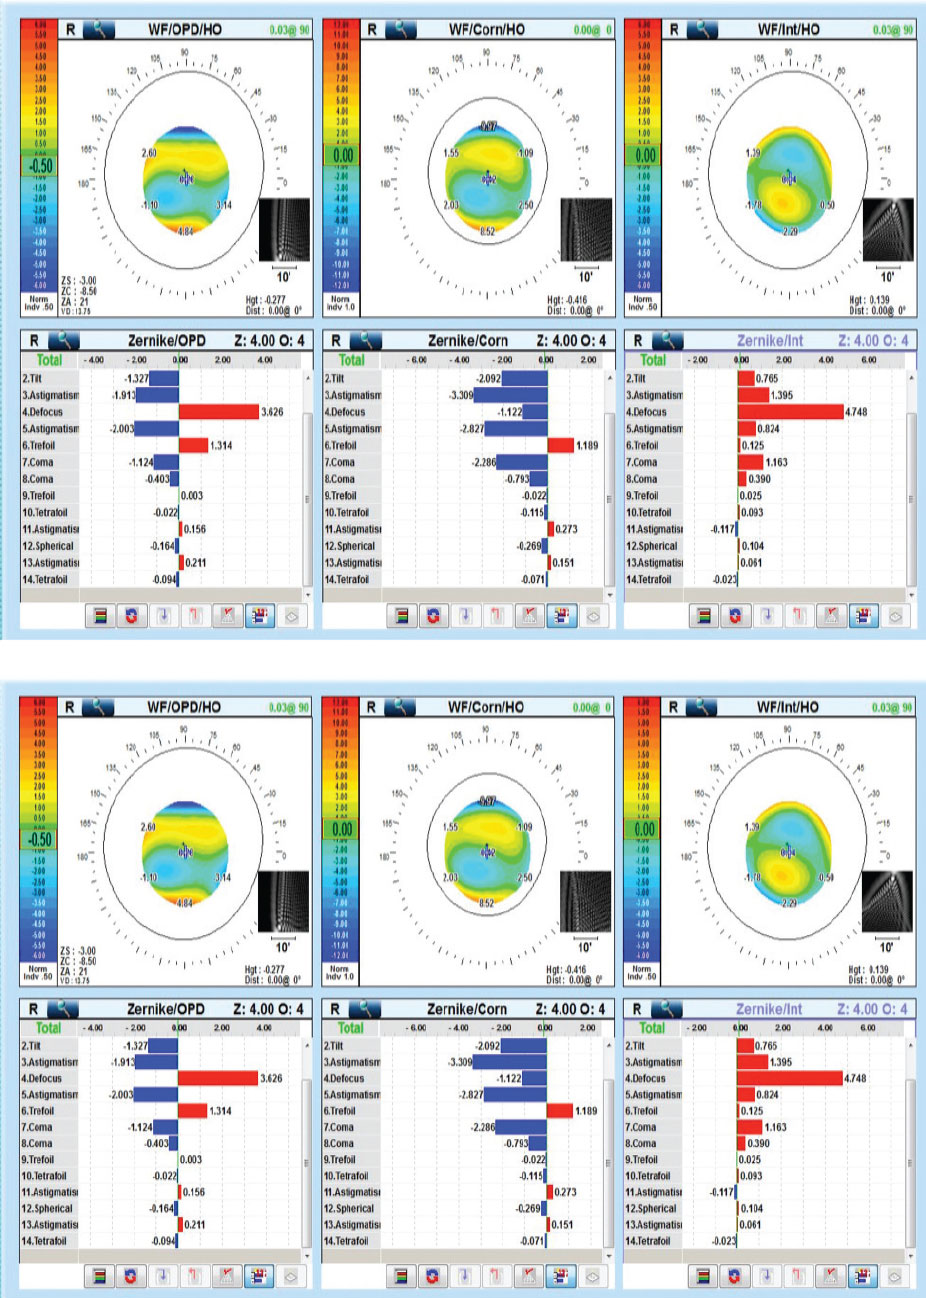 |
| OPD aberrometry of the right and left eyes shows vertical coma often seen in patients with keratoconus. |
Aberrometry and Aberrations
Wavefront aberrometers analyze the findings produced by optical systems using three distinct methods. Based on these methodologies, clinically available instruments can be divided into three classifications: outgoing wavefront aberrometers (e.g., the Hartmann-Shack wavefront sensor), ingoing retinal imaging aberrometers (e.g., the Tscherning aberrometer) and ingoing feedback aberrometers (e.g., the Marco/Nidek Optical Path Difference (OPD)-Scan III). The devices belonging to these three categories differ based on their measurement speed, refractive error range, analysis and display options and ability to measure different aberrations. While these tools have their differences, all are more successful and provide more information when combined with other technologies (e.g., topography and medical imaging).
Carefully analyzing integrated wavefront aberrometry results can be useful in obtaining a detailed analysis of the optical pathway from the pre-corneal tear film to the vitreous humor and the retina. Characterizing the optics by the type and location of aberrations that are occurring allows clinicians to detect, diagnose and treat conditions that have optical consequences at every stage of development in an effort to reduce optical consequences. It can help also clinicians better understand contact lens and specialty contact lens interactions with the entire optical system, not just the corneal surface.
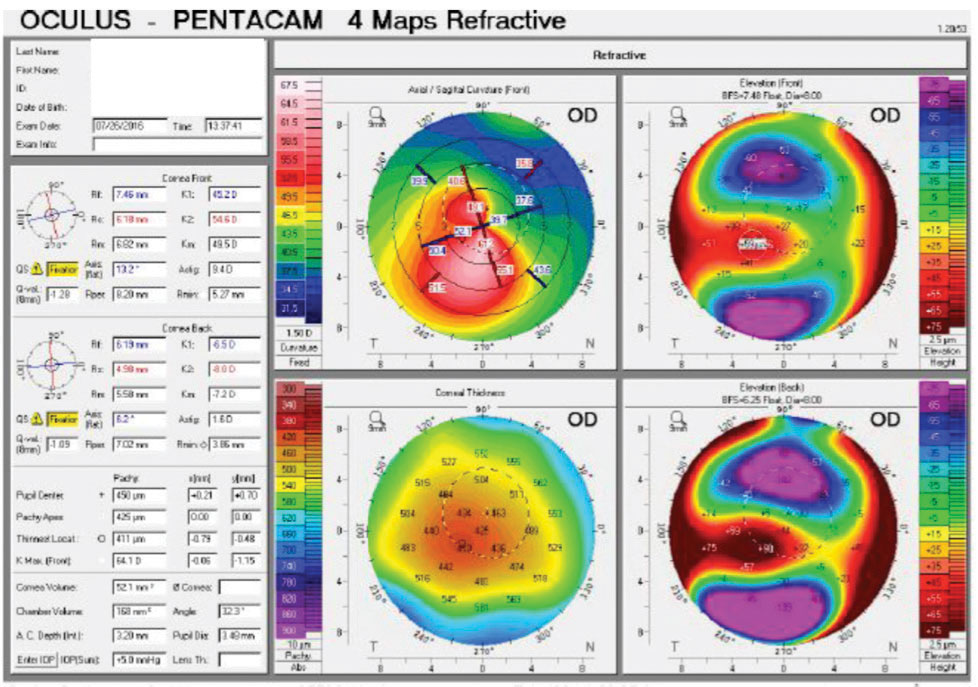 |
| Oculus Pentacam refractive maps of the right and left eyes show adequate corneal thickness (>400 microns) and evidence of keratoconus in both eyes. |
The most important information added to a clinician’s data stream with the use of integrated wavefront aberrometry is in regard to higher-order aberrations (HOAs) and the physiological alignment of the optical elements of the system.
The two most common HOAs in healthy eyes are vertical coma and spherical aberration.3 Diseases or conditions that affect the optical components of a patient’s eye, including ectasia, can cause HOAs, such as trefoil, tetrafoil and secondary astigmatism, which are located on the front or back surface of the cornea. Cataracts—often in very early stages—can be accompanied by high levels of trefoil due to the internal optics of the lens.
Analyzing HOAs helps differentiate conditions, such as keratoconus and pellucid marginal degeneration (PMD). In both, the mean axes of the coma are opposite those in healthy eyes.4 However, the magnitude of the coma is significantly lower in PMD than in keratoconus. Further setting the two conditions apart, spherical aberrations in eyes with PMD have a plus sign while these aberrations in eyes with keratoconus have a minus sign.
 |
| OPD elevation maps show an elevation, axial and instantaneous map in the right eye of this keratoconus patient. |
Angles Kappa and Alpha
While wavefront aberrometers show us the characteristics of the total optics of the eye, they do not allow us to understand the functional consequences of each specific optic location and, thus, have limited value in evaluating patients for contact lenses. However, combining aberrometry with corneal topography, and pupillometry allows us to assess the physiological alignment of the optical structures in the eye, locate HOAs and lower-order aberrations in the optical pathway and analyze the effects of pupil size, which affects the angular aperture of light entering the posterior part of the eye.2 Furthermore, the larger diameter analysis of refractive error helps us decide which contact lens to choose during a patient’s evaluation.
Research into refractive surgery shows us that centering laser-ablation treatment zones over the pupil can be problematic for patients with large angle kappas—the angle between the visual axis and the pupillary axis—due to significant discrepancies between the axes.2 A large angle kappa or angle alpha—the angle between the optical axis and the center of the cornea—can also present challenges when fitting patients with multifocal intraocular lenses.2
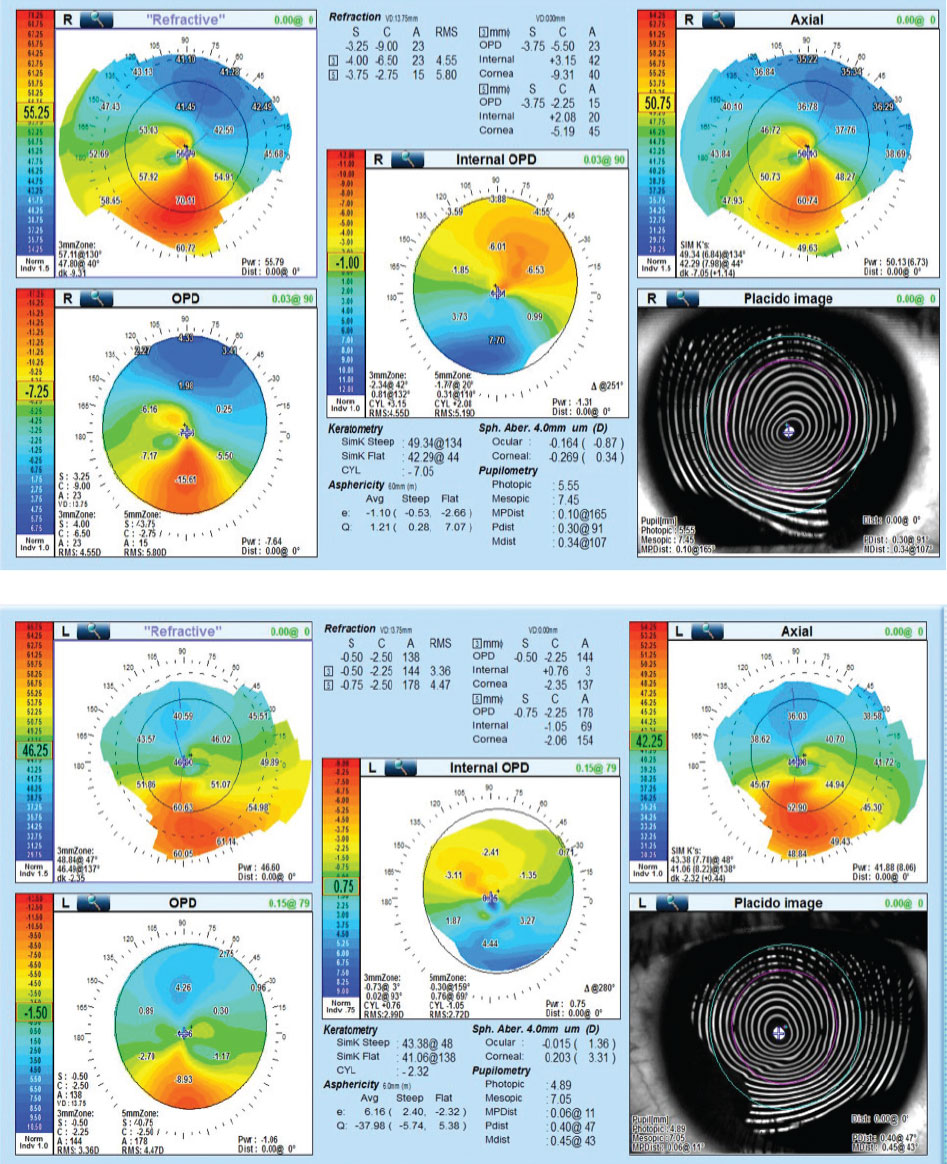 |
| Internal OPD aberrometry of the right and left eyes shows refractive distribution mapping that illustrates refractive irregularities inferior central in both eyes. |
Combining corneal topography and wavefront aberrometry allows these devices to evaluate the distance between the pupillary center and the visual axis.2 Many doctors rely on fixation patterns to estimate the location of the visual axis. Use of a device capable of finding the longest light ray (the optical axis) helps to identify the visual axis.2 The device then calculates the distance and the angle from the optical axis to the center of the pupil under photopic and mesopic conditions.2 It also identifies the limbus, locates the geometric center of the limbal ring (the cornea) and calculates the angle alpha.2
Contact lenses are usually centered or nearly centered on the cornea.2 The closer the center of a lens is to the optical axis, the more symmetric the combined power distribution is around the optical axis.2 The further the center of a lens is from the optical axis, however, the more asymmetric the combined power distribution is around the optical axis.2 This asymmetric power distribution creates HOAs, particularly coma, and results in negative visual symptoms.2
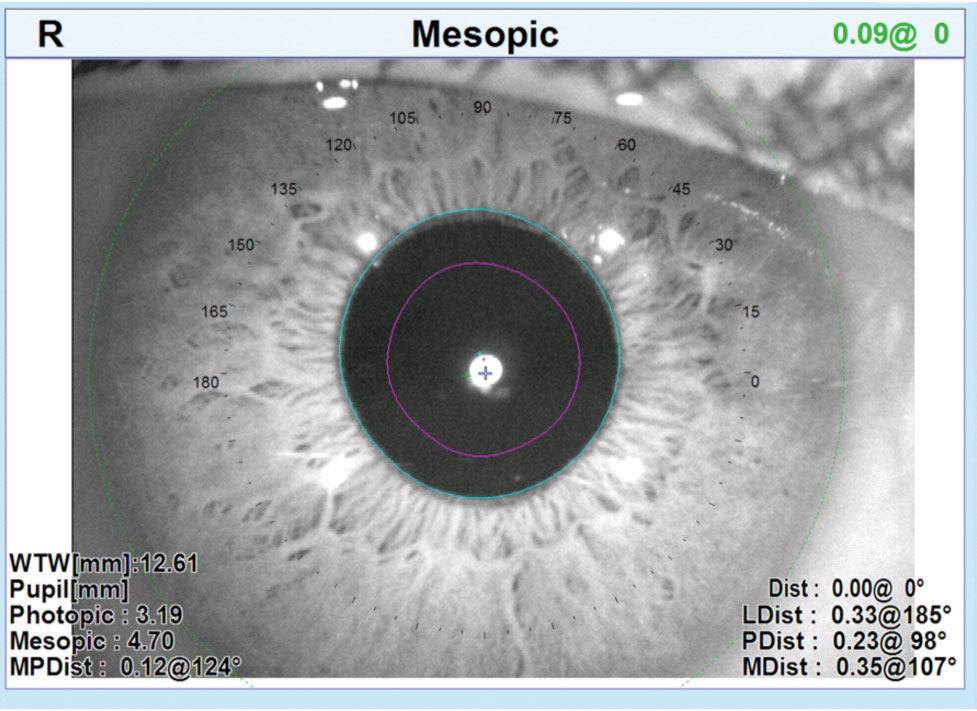 |
| The OPD-Scan III can take angle kappa and angle alpha measurements as well as photopic and mesopic measurements. |
Multifocal Fits
When considering the large curvature change and power distribution associated with soft multifocal contact lenses, success depends on the alignment of the multifocal optics with the visual axis.2 Misalignment alters the way patients perceive visual clues and may occur for several reasons, including scleral or corneal misshape, nasal decentration of the pupil and/or temporally displaced foveas.2 A significant misalignment can be problematic and may result in reduced visual acuity, induced aberrations and patient complaints of glare, shadows, 3D effects and halos.2 Unfortunately, the conventional method of fitting soft multifocal contact lenses does not ensure appropriate alignment of multifocal optics over the visual axis, leading to unsuccessful fits and unhappy patients.2
To investigate how often contact lenses decenter and whether the decentration is consistent or variable, researchers have employed corneal topographers to measure the surface profile of four different brands of similarly designed soft multifocal contact lenses.2 After analyzing the topography maps of the soft multifocal contact lenses worn on-eye, a team found that the optical zones of the lenses were consistently displaced temporal to the visual axis.2 They note that the misalignment amount among 18 patients varied from 0mm to 1.25mm temporally.2 Another group discovered similar results, with an average misalignment of 0.78mm temporally among 63 eyes.2 These studies found that lenses often decenter temporally to a variable amount.2
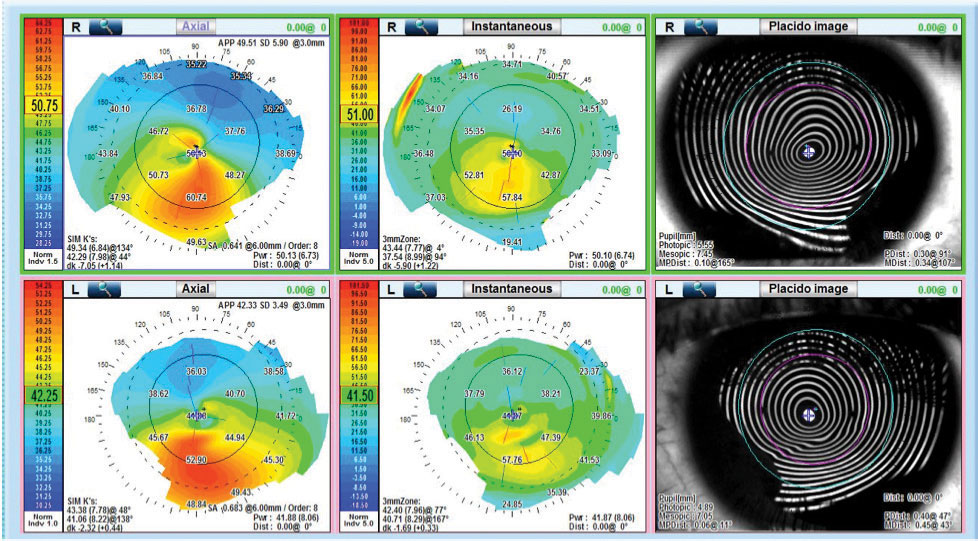 |
| OPD corneal topography shows the axial or anterior corneal topography and the instantaneous or tangential topography. |
Misalignment Management
Clinicians can evaluate misalignment between the multifocal optics and the visual axis by comparing the corneal topography of a patient without soft multifocal contact lenses with the corneal topography of the patient with soft multifocal contact lenses.2 To effectively make this comparison, use the topographer’s “difference display” map setting, which is also known as “subtractive” or “comparative” maps.2 The topographer will then subtract the map taken over the contact lens from the baseline map of the patient’s bare cornea to provide valuable information about the multifocal optics.2
The process looks like this:2
- Perform baseline corneal topography without a contact lens.
- Place a soft multifocal contact lens on the eye, preferably one with a high add power to enhance the view of the central optics when examining the topography results.
- Allow the contact lens to settle in order to ensure good centration and proper lens alignment. If the lens does not fit well, choose another and start over.
- Perform corneal topography while instructing the patient to view the proper fixation target.
- Display the maps in tangential power. Depending on the topographer make and model, the function may be labeled “tangential,” “curvature” or “instantaneous.”
- Use the topographer’s difference display or subtractive or comparative functions. The option will either appear as three topographic maps on the same button or on a dropdown menu reading “diff,” “refractive compare” or “power difference.”
- Select the baseline map and the topographical map taken over the contact lens (both in tangential and instantaneous power) to produce a third “tangential power difference” map. A difference/comparative/subtractive map will also be generated next to the baseline and over-contact lens maps.
- Adjust the color display scale on the difference map to highlight the power profile in the optical zone of the contact lens.
- Measure the distance between the patient’s visual axis (center of the map) and the center of the multifocal optics with the measurement function. If the distance is measured at 0.50mm or more, consider using offset optics.
Information regarding the aberration profile created when decentered soft multifocal contact lenses interact with the rest of the optical system is clinically predictive of success and helps doctors determine the fitting methodology they should employ for each patient but cannot be gathered using one technique alone. Integrating wavefront aberrometry with corneal topography and medical imaging can be valuable in helping doctors identify patients with irregular astigmatism who require specialty contact lenses. Early detection and diagnosis of conditions affecting a patient’s optical system allow doctors to swiftly initiate examinations and fittings to successfully manage patient symptoms and improve visual performance over time.
Dr. Wong is an associate clinical professor, director of new technologies and director of clinical externships at the SUNY College of Optometry. He is on the Board of Governors at Georgetown University, a consultant for Marco Ophthalmics, an AOA representative to the Physician Consortium for Performance Improvement (PCPI) and on the PCPI Technical Expert Panel.
Dr. Petito is an author and a lecturer on various topics related to ocular care. He practices in St. Petersburg, FL, and specializes in complex contact lens and low vision patients. He is the primary AOA representative to the PCPI, on the PCPI Technical Expert Panel and the Director of Professional Relations for Marco Ophthalmics.
1. Vinciguerra R, Ambrósio Jr. R, Elsheikh A, et al. Detection of keratoconus with a new biomechanical index. J Refract Surg. 2016;32(12):803-10. 2. SpecialEyes. Three ways to identify multifocal misalignment issues. specialeyesqc.com/blog/identify-multifocal-misalignment-issues/. Published August 20, 2018. Accessed September 20, 2018. 3. Legerton J. Is wavefront aberrometry a good fit for contact lens practice? RCCL. 2013;150(8):24-6. 4. Kosaki R, Maeda N, Bessho K, et al. Magnitude and orientation of Zernike terms in patients with keratoconus. Invest Ophthalmol Vis Sci. 2007;48:3062-8. |