 |
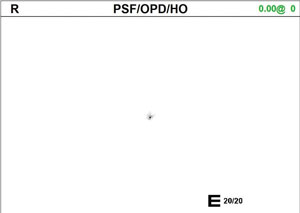
| The point spread function helps uncover corneal abnormalities. Here, a cornea shows no distortion. |
The Cornea Up Close
Before proceeding, it’s helpful to refresh our memories on the basic corneal anatomy and physiology we all learned in school so that we can better recognize when problems occur. The corneal layers, totaling an average of 540μm in thickness, include the epithelium, Bowman’s layer, stroma, Descemet’s membrane and endothelium.1-2 The stroma and epithelium make up the majority of the cornea’s tissue thickness.
The tear film, while a distinct entity, interacts with the corneal epithelium; one cannot exist without the other, and their interactions are an important consideration when diagnosing corneal irregularities.
Due to eyelid friction, the superior epithelium is thinner compared with the inferior region. Greater frictional forces are applied to the superior cornea as the upper lid reaches its maximum speed as it crosses the visual axis.3-7 The lid then skims across the inferior part of the cornea. Due to the anatomical difference between the nasal and temporal aspects of the cornea, the epithelium is thinner on the temporal side as the outer canthus is higher than the inner canthus. In addition, the temporal portion of the lid is higher than the nasal side.
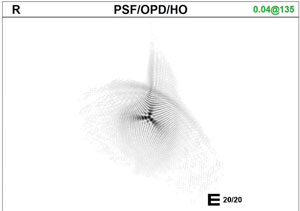 |
| A distorted point spread function, as seen here, indicates a surface abnormality. |
The corneal endothelium—a monolayer of hexagonal cells that cover the posterior surface of the cornea—maintains the transparency of the corneal stroma by controlling corneal hydration.9 These specialized cells do not regenerate, so when cellular abnormalities occur, the corneal stroma swells, changing the collagen arrangement and affecting transparency.
Identifying Pathology
The relationship between epithelial and stromal thickness during an episode of edema and corneal desiccation can be monitored with OCT global pachymetry imaging.10 The maps of the epithelium, stroma and total corneal thickness are useful during routine screening to identify corneal abnormalities such as dry eye disease (DED) and ectasia.11 OCT imaging is also helpful in observing corneal intrusion with foreign bodies, surgical sutures, corneal dystrophies, infiltrates and corneal ulcerations. Finally, revealing the interaction of the epithelium and stroma also highlights the process of healing and can improve surgical outcomes when the cornea is involved.
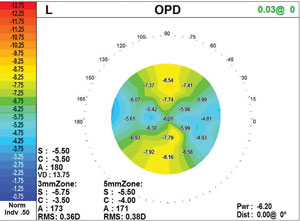 |
| The power map, this one showing astigmatism, is key to understanding the changes in corneal shape. |
The first stage of ectasia is the thinning of the stroma, although detection becomes difficult due to the corneal epithelium responding by becoming thicker, causing the total corneal thickness to remain unchanged. The only method of detecting the thickness of the epithelium and stroma using global pachymetry is with software that separates the layers—a feature that will become a modification on current anterior segment OCT devices as software improves. The epithelium becomes thicker over the depression and thinner over the elevations, smoothing over the corneal stromal irregularities and creating aberration-free visual acuity during the initial stages of the disease.12
As ectasia progresses, the epithelium begins to thin after the initial thickening stage, and the cornea distorts at the site of the stromal thinning. At the same time, the epithelium thins, forming a base encircling the area of stromal thinning giving support to the structure.13
In ectasia the collagen fibrils shift toward a preferred orientation of 20/160 degrees. There is also an increase in the irregularity of the scattering of the fibrils. The orientation of collagen fibrils inside the cone is altered considerably, while those in the periphery retain the preferred vertical/horizontal orientation.
Corneal topography assumes this change in collagen structure that affects the shape of the cornea.14 In Scheimpflug topography, a spinning mirror provides an enhanced depth of focus without distorting the image. Clinicians can image not only the curvature of the anterior cornea (as with placido-based topography), but also elevation of the anterior cornea, pachymetry and curvature of the posterior cornea. Indices such as center surround index, surface regularity index and standard deviation of the power quantify the change in corneal shape.
The most common index used with Scheimpflug topography is the Belin-Ambrosio Enhance Ectatic Display, which uses a modified best-fit sphere to classify the shape of the cornea. In a central 8mm zone, the thinnest part of the cornea is excluded (so that it does not skew the best-fit sphere). This enhanced best-fit sphere is compared to the standard best-fit sphere.15 If there is no pathology, those spheres will agree, but the difference between those spheres will be significant when ectasia is present. Studies have found that the Belin-Ambrosio index can predict risk of ectasia prior to refractive surgery.16,17 But, perhaps most impactful for optometrists, research suggests it can be extremely predictive for distinguishing a normal cornea from keratoconus or other non-inflammatory thinning disorders, such as pellucid marginal degeneration.18
 |
| The epithelium thickens peripherally, lending support at the base of the stromal thinning. |
Corneas with DED have exhibited corneal epithelium thickness variation due to inflammation and desquamation of the cellular layer. During the initial stages of DED, the inflammatory processes and epithelium proliferation causes epithelium thickening. As the disease progresses, limbal stem cell atrophy results in epithelial thinning. Because superior and inferior stem cell population in the normal eye is greater in the superior and inferior cornea than the nasal and temporal regions, epithelial thickness change is more dramatic in the peripheral cornea than the central.19
As the tear film becomes more deficient and lubrication is reduced, greater frictional force upon the superior cornea results in an increase of cell loss. Research also shows tear deficient patients increase their blinking rate, causing even greater frictional force on the epithelium and additional cell loss and thinning.20 Investigators suggest long-term soft contact lens wearers also experience a thinning epithelium.21
Corneal Endotheliopathies
Since the endothelium is a 5μm monolayer, it is difficult to observe pathology without the use of a specular microscope.22 A specular microscope provides useful information when observing dystrophies and effects of contact lens wear. It is also helpful for ensuring the endothelium is functioning properly before presurgical intervention.
Normal cell loss occurs every year but can be exaggerated by uveitis, glaucoma, Fuchs’ dystrophy, contact lens wear and intraocular surgery.9 When cells die, they slough off the posterior surface of the cornea—compromising the endothelium mosaic and affecting function.
During contact lens wear and presurgical evaluations, visualizing the condition of the endothelial cellular arrangement is crucial to avoid potential damaging effects.23,24 Endothelial cell loss can render the cornea ineffective in controlling corneal hydration, resulting in pathological edema.
Contact lenses can induce endothelium change with high pleomorphism and polymegethism but also a decrease in endothelial cell density. Loss of endothelium cell density is correlated with length of time wearing contact lenses.23,24 The only method to observe changes in the corneal endothelium while wear contact lenses is with a specular microscope. This becomes important for future positive outcomes from ocular surgery such as cataract extraction and refractive surgery.
Patients might experience clinical signs of contact lens intolerance associates with hypoxia, especially while wearing large diameter scleral lenses or hybrid lenses. In addition to photophobia, contact lens intolerance, foggy, hazy or fluctuating vision, indicate the endothelium might be compromised. Any patient who exhibits signs of reduced vision after a few hours of wear without any other explanation should be examined with a specular microscope. Many of these patients are experiencing endotheliopathies.
 |
| Epithelium damage from corneal ulcer and foreign body. |
Corneal hysteresis is a measure of elasticity of the tissue and the ability of the cornea to dissipate energy when the shape is disrupted. The one commercially available device for measuring corneal hysteresis, the Ocular Response Analyzer (ORA, Reichert), records IOP as a puff of air indents the cornea and then as the cornea rebounds to its original shape.17 The difference in these two IOPs is recorded as corneal hysteresis (CH), which is actually a measure of corneal viscosity (how the cornea resists applied force).18 Clinical trials have used these two measurements to develop a constant for corneal thickness known as corneal resistance factor (CRF).25
Studies show CH and CRF are somewhat variable in healthy subjects, although there is a general trend toward greater CH as healthy patients age.26-28 When the cornea is thinned in either a pathological process such as keratoconus, or in a surgical process such as LASIK or LASEK, CH decreases.29 When the cornea is strengthened in corneal crosslinking, CH increases.30 Research shows eyes with pseudophakic bullous keratopathy have significantly reduced CH and CRF, which increase after DSAEK.31
Low CH is also associated with different forms of glaucoma, including primary open-angle, primary angle-closure, pseudoexfoliative and congenital.32 Because IOP measurements with Goldmann applanation tonometry may be different in patients with low CH and CRF, some researchers recommend glaucoma patients with low CH and CRF be treated more aggressively.32,33
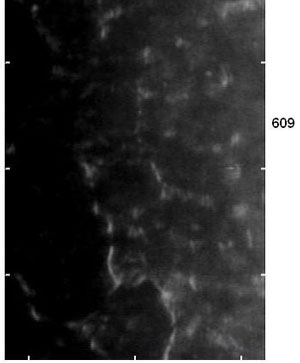 |
| Specular microscopy, as seen here, can help clinicians observe changes in the corneal endothelium caused by dystrophies and contact lens wear. |
Patients come in every day with 20/20 vision, yet still discuss their inability to function at night or see clearly during the day—and the shape of the cornea is often the key.
The normal corneal curvature range is no more than 10D; anything greater than that suggests corneal shape abnormalities that can affect vision.34 If the power change created by the curvature across the cornea cannot be adequately corrected with spectacles due to the difference between the flattest and steepest curve, contact lenses (often rigid lenses) are indicated.
A combination autorefractor/keratometer can help clinicians uncover corneal shape and surface abnormalities useful for refractive and surgical outcomes.
Depending on the level of distortion seen on an autorefractor’s point spread function, two prescriptions may be necessary, and the power map is key to understanding why. As the power map changes from the apex of the cornea during dim illumination, the prescription will change during dilation.
The axial map measures the range of curvature distributed across the corneal surface. They are spherical biased and calculated from light rays projecting through the optical axis as a reference point. This smooths out the data, which can hide corneal abnormalities.
The instantaneous display or the tangential curvature map, best for understanding the true corneal shape and defining an ectatic cornea, does not use a reference axis and illustrates transitions in curvature with greater sensitivity.2,35
Diagnostic instruments help us identify corneal abnormalities within the ocular system by first defining the initial changes from the normal structure—far sooner than can be seen through a slit lamp. Armed with more knowledge of both normal and abnormal corneas, clinicians can readily identify the initial stages of disease and promptly institute treatment strategies.
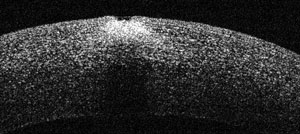
| Ultrasound vs. OCT |
| Although ultrasound pachymetry is still the standard for measuring corneal thickness, OCT pachymetry is rapidly taking its place. The inherent error in ultrasound’s hand-driven measurement is hard to overlook compared with a computer-driven tool. Research shows a statistically significant variance between ultrasound and OCT, with ultrasound measuring greater thickness compared with other techniques.1 1. Dutta D, Rao HL, Addepalli UK, Vaddavalli PK. Corneal thickness in keratoconus: comparing optical, ultrasound, and optical coherence tomography pachymetry. Ophthalmology. 2013;120(3):457-63. |
Dr. Sonsino is a partner in a high-end specialty contact lens and anterior segment practice in Nashville, Tenn. He is a diplomate in the Cornea, Contact Lens, and Refractive Therapies Section of the AAO, chairman of the Cornea and Contact Lens Section of the American Optometric Association, a fellow of the Scleral Lens Education Society, board certified by the American Board of Optometry and the 2017 Gas Permeable Lens Institute practitioner of the year.
1. Francis BA, Varma R, Chopra V, et al. Intraocular pressure, central corneal thickness, and prevalence of open-angle glaucoma: The Los Angeles Latino Eye Study. Am J Ophthalmol. 2008;146(5):741-6.
2. Gordon MO, Beiser JA, Brandt JD, et al. The Ocular Hypertension Treatment Study: baseline factors that predict the onset of primary open-angle glaucoma. Arch Ophthalmol. 2002;120:714-20.
3. Reinstein DZ, Archer TJ, Gobbe M, et al. Epithelial thickness in the normal cornea: three-dimensional display with Artemis very high frequency ultrasound. J Refract Surg. 2008;24(6):571-81.
4. Li Y, Tan O, Brass R, et al. Corneal epithelial thickness mapping by fourier-domain optical coherence tomography in normal and keratoconic eyes. Ophthalmology. 2012;119(12):2425-33.
5. Rocha KM, Straziota CP, Stulting RD, Ranleman JB. Spectral-domain OCT analysis of regional epithelial thickness profiles in keratoconus, postoperative corneal ectasia, and normal eyes. J Refract Surg. 2013;29(3):173-9.
6. Zhou W, Stojanovic A. (2014) Comparison of corneal epithelial and stromal thickness distributions between eyes with keratoconus and healthy eyes with corneal astigmatism ≥2.0D. PLoS One. 2014;9(1):e85994.
7. Sin S, Simpson TL. The repeatability of cornea and corneal epithelial thickness measurements using optical coherence tomography. Optom Vis Sci. 2006;83(6):360-5.
8. Gillan W. The stroma and keratoconus: a review. S Afr Optom. 2007;66(3):87-93.
9. Thomas C. Use specular microscopy to diagnose corneal disease. Rev of Optom 2009;146(6):69-74.
10. Spöler F, Frentz M, Schrage NF. Towards a new in vitro model of dry eye: The ex vivi Irritation Test. Dev Ophthalmol. 2010;45:93-107.
11. Liang Q, Liang H, Liu H, et al. An ocular surface epithelial thickness evaluation in dry eye patients: clinical correlations. J Ophthalmol. 2016;2016:1628469. Epub.
12. Vinciguerra P, Piscopor R, Camesasca F, Vinciguerra R. Progression in keratoconus. Int J Kerat ECT Cor Dis. 2016;5(1):21-31.
13. Kanellopoulos AJ, Aslanides IM, Asimellis GE. Epithelial thickness: an indicator for early keratoconus? Surgery Today. June 2013. Epub.
14. Burns DM, Johnston FM, Frazer DG, et al. Keratoconus: an analysis of corneal asymmetry. Br J Ophthalmol. 2004;88:1252-5.
15. Ambrosio R Jr, Nogueira LP, Caldas DL, et al. Evaluation of corneal shape and biomechanics before LASIK. Int Ophthalmol Clin. 2011;51(2):11-38.
16. Gilani F, Cortese M, Ambrósio RR Jr, et al. Comprehensive anterior segment normal values generated by rotating Scheimpflug tomography. J Cataract Refract Surg. 2013;39(11):1707-12.
17. Ambrósio R Jr, Nogueira LP, Caldas DL, et al. Evaluation of corneal shape and biomechanics before LASIK. Int Ophthalmol Clin. 2011;51(2):11-38.
18. Ambrósio R Jr, Caiado AL, Guerra FP, et al. Novel pachymetric parameters based on corneal tomography for diagnosing keratoconus. J Refract Surg. 2011 Oct;27(10):753-8.
19. Kannellopoulos AJ, Asimellis G. In vivo-3 dimensional corneal epithelial thickness mapping as an indictator of dry eye: preliminary. Am J Ophthalmol. 2014;157(1):63-8.
20. Cui X, Hong J. Assessment of corneal epithelial thickness in dry eye patients. Optom Vis Sci. 2014;91(12):1446-54.
21. Hong J, Qian T, Yang Y, et al. Corneal epithelial thickness map in long-term soft contact lenses wearers. Optom Vis Sci. 2014;91(12):1455-61.
22. John T. Corneal clarity: a review of the three faces of the corneal epithelium. Ophthalmology Management. 2013;17:20-7.
23. Seta¨la K, Vasara K, Vest Ei, Ruusuvaara P. Effects of long-term contact lens wear on the corneal endothel. Acta Ophthalmol Scand. 1998:76:299–303.
24. Liesegang TJ. Physiologic changes of the cornea with contact lens wear. CLAO J. 2002;28(1):12-27.
25. Kaushik S, Pandav S. Ocular Response Analyzer. J Curr Glaucoma Pract. 2012;6(1):17-9.
26. Rosa N, Lanza M, De Bernardo M, et al. Relationship between corneal resistance factor with other ocular parameters. Semin Ophthalmol. 2015;30(5-6):335-9.
27. Wang JK, Huang TL, Pei-Yuan Su, Chang PY. Factors affecting corneal hysteresis in Taiwanese adults. Eye Sci. 2015;30(3):89-93.
28. McMonnies CW. Assessing corneal hysteresis using the Ocular Response Analyzer. Optom Vis Sci. 2012;89(3):E343-9.
29. Kirwan C, O’Keefe M. Corneal hysteresis using the Reichert Ocular Response Analyser: findings pre- and post-LASIK and LASEK. Acta Ophthalmol. 2008;86(2):215-8.
30. Beckman Rehnman J, Behndig A, Hallberg P, Lindén C. Increased corneal hysteresis after corneal collagen crosslinking: a study based on applanation resonance technology. JAMA Ophthalmol. 2014;132(12):1426-32.
31. Faramarzi A, Feizi S, Najdi D, et al. Changes in corneal biomechanical properties after Descemet stripping automated endothelial keratoplasty for pseudophakic bullous keratopathy. Cornea. 2016;35(1):20-4.
32. Deol M, Taylor DA, Radcliffe NM. Corneal hysteresis and its relevance to glaucoma. Curr Opin Ophthalmol. 2015;26(2):96-102.
33. Pillunat KR, Hermann C, Spoerl E, Pillunat LE. Analyzing biomechanical parameters of the cornea with glaucoma severity in open-angle glaucoma. Graefes Arch Clin Exp Ophthalmol. 2016;254(7):1345-51.
34. Kojima R, Eiden SB. What corneal shape reveals about corneal health. RCCL. 2016;5:30-5.
35. Tummanapalli SS, Potluri H, Vaddavalli PK, Sangwan VS. Efficacy of axial and tangential corneal topography maps in diagnosing keratoconus suspects. Invest Ophthalmol Vis Sci. 2012;53(14):122.