There’s been increasing evidence in recent years that manufacturers of anterior segment imaging technologies, the contact lens industry and practitioners globally are changing from a mindset based on corneal curvature to one with its foundations in sagittal height elevation data. Is this just a new trend in the ever-evolving landscape of cornea and contact lens practice or a sign of the times that curvature data is becoming obsolete?
The truth lies somewhere in the middle, but it is a notable evolution and one that the eyecare community should be comfortable with and supportive of. How does this affect the way we are practicing and characterize what technology we should have available for our patients? How does this affect the way corneal imaging manufacturers innovate and the larger contact lens industry? All these categories have been changing for years, away from the radius of curvature and dioptric power measurements to topographical shape measurements based on elevation data.
This two-part series will review the tools available to practitioners today to best understand the shape of the cornea and sclera. Part one will take a diagnostics perspective, while part two (in the May/June issue) will discuss how to use these technologies to assist our lens fitting practices.
Purpose of Topography
The word topography comes from the Greek words “topo,” meaning a place or area, and “graphia,” meaning to chart or record. Although corneal topography is a staple in many eyecare clinics, it may be valuable to take a broader look at topography used elsewhere, as the goal is to understand changes in terrain and landscape in an area of interest. Common everyday uses of topography include land surveys, outdoors activities (hiking, mountain climbing), civil engineering and city planning, evaluating flood plains and more.
The overall purpose of corneal topography is to understand the shape of the cornea and, from that, to assess its overall effect on the vision of that eye. The most obvious and discussed indications for corneal topography are in contact lens fitting and for detecting keratoconus with subsequent monitoring. Other uses include preoperative evaluation of irregular astigmatism or potential ectasia prior to LASIK, implantable collamer lens surgery or lens replacement surgery; it may also be used to determine postsurgical topography after corneal transplants, corneal dystrophies, peripheral corneal degenerations, bullous keratopathy, pterygium or even monocular diplopia.
Technologies to Evaluate Corneal Shape
 |
|
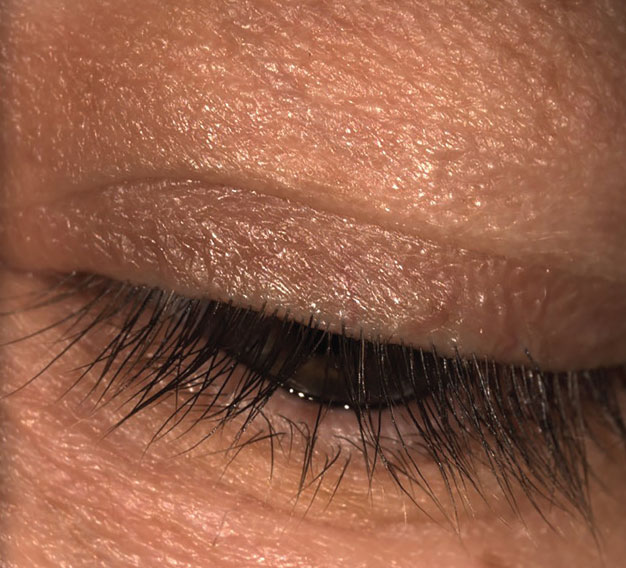
Fig. 1. Munson’s sign in keratoconus. Click image to enlarge. |
The most basic method of shape evaluation is simply direct observation of the eye from a perpendicular viewpoint. From a superior viewpoint while in downgaze, one can assess corneal shape and sagittal height protrusions; this would indicate a positive Munson’s sign (Figure 1). Munson’s sign is commonly seen in keratoconus and with proud penetrating keratoplasty (PKP) corneal grafts. Additionally, from a lateral viewpoint, prolate shape, oblate shape (Figure 2) and irregular corneal/ocular features may be seen. A similar qualitative measurement of corneal shape can be obtained from the slit lamp biomicroscope with an optic section beam and the oculars offset 45° to 60° (Figure 2) wherein the contour of the corneal front and back surfaces are observed.
Although these are nice and easy techniques to routinely evaluate all corneas, they offer no measurable quantitative data to monitor for change.
 |
|
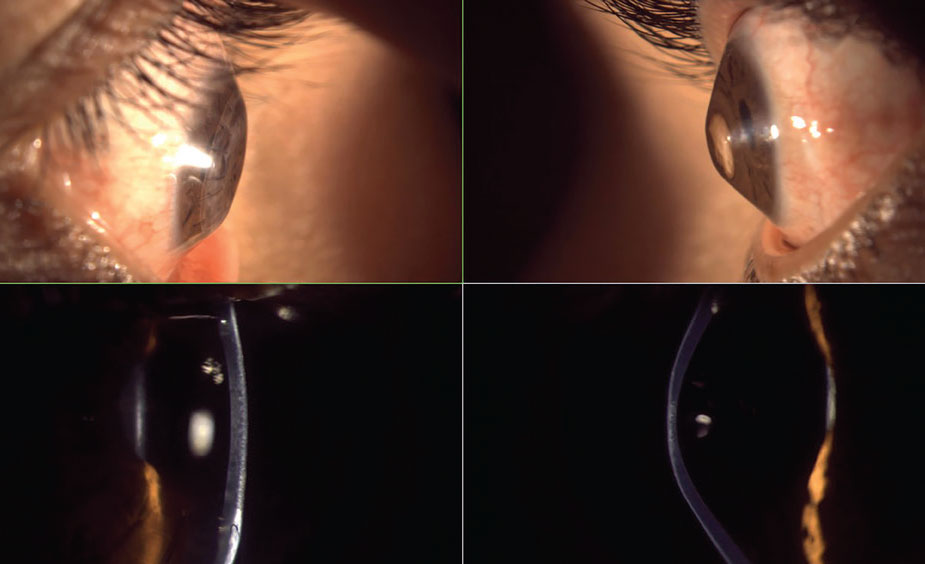
Fig. 2. Severe oblate (left) and prolate (right) corneas with lateral gross observation and optic section biomicroscopy—interestingly, from the same patient. Click image to enlarge. |
Keratometry
Some of our earliest quantitative measurements of corneal curvature came from manual keratometry. This advancement allowed practitioners to measure the radius of curvature and subsequently the dioptric power of the cornea; however, this was limited to a fixed chord of only 2mm or 3mm within the central optic zone of the cornea and only along two principal meridians. Distortion to the keratometry mires attributed to dryness or corneal irregularities were qualitative instead of quantitative but could be useful clinically, for instance, in evaluating contact lenses in situ for lens flexure. Subsequent automated keratometers likewise provide central curvature data limited to a 3mm to 4mm zone and are often more time-efficient and require essentially no technical skill or knowledge, but they lack the qualitative analysis provided by the automated keratometry projected mires.1 Neither manual nor automated keratometry provide elevation data, nor are they clinically useful in assessing the mid-peripheral to peripheral cornea where many pathologies occur.
Placido Disc Topography
The most commonly used corneal assessment devices in eyecare practices since the latter part of the 20th century, and with the greatest number of manufacturers and models, are Placido disc corneal topographers. By measuring the distance and variations of concentric rings that are projected onto the cornea (keratoscopy) compared with a reference calibration sphere, the curvature of the cornea is mapped in a color-coded scale (keratography), with warmer colors representing steeper curvatures and cooler colors representing flatter curvatures.2
 |
|
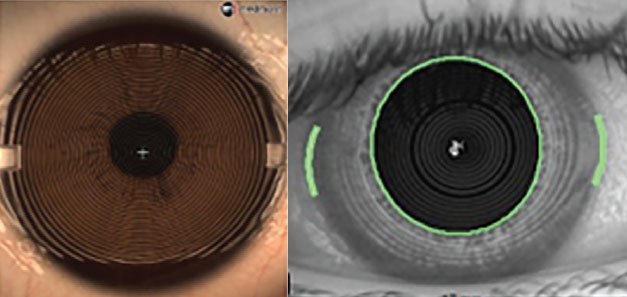
Fig. 3. Small-cone topography (left) with greater number of Placido rings and capture diameter than large-cone topography (right). Click image to enlarge. |
Placido disc devices can be separated into two categories: small-cone and large-cone (Figure 3). Small-cone devices may be more accurate and provide more data, as they use more projection rings with far more data points, but they operate at a closer imaging distance, which may be challenging with prominent brow and orbital bone structures.3
Sophisticated algorithms are used to calculate curvature and power data relative to the optical axis line of reference between the topographer camera and the cornea (e.g., axial or sagittal maps) or relative to points not centered on the optical axis (e.g., tangential or instantaneous maps). As in keratometry, distortions in the projected rings, referred to as “ring jam,” can be caused by tear film dryness, punctate keratopathy, corneal scarring, sutures or abrupt curvature changes (e.g., PKP graft-host junction). Topography likewise may be used to measure contact lens flexure as well as image multifocal optics or prism of a lens in situ.
With many tens of thousands of data points across the cornea, a much more accurate representation of corneal shape can be achieved than with keratometry. While older versions of Placido disc topographers could only measure 6mm to 9mm of the cornea, newer models can capture up to or including the limbus in a single capture or as a multi-image composite.4 As seen in Figure 4, simulated keratometry (Sim K) values will still be limited to the central 3mm to 4mm zone and will still miss typical inferior ectasias; however, there will be algorithmic symmetry analytics to help identify irregularities as well as a more complete visual representation of the corneal geography.
 |
|
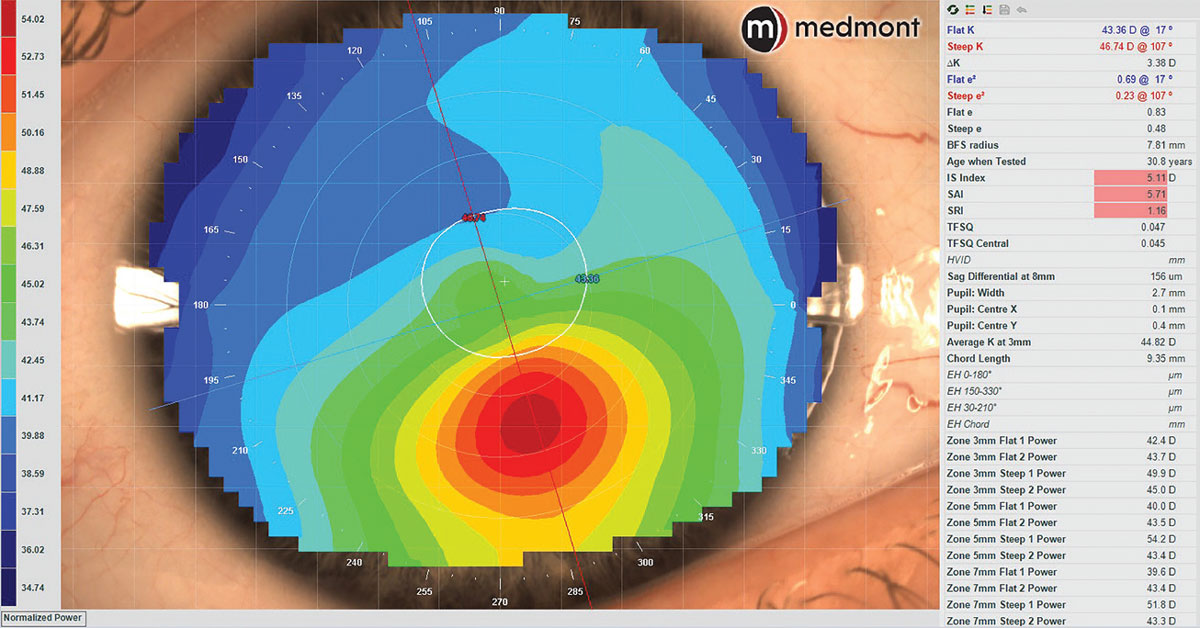
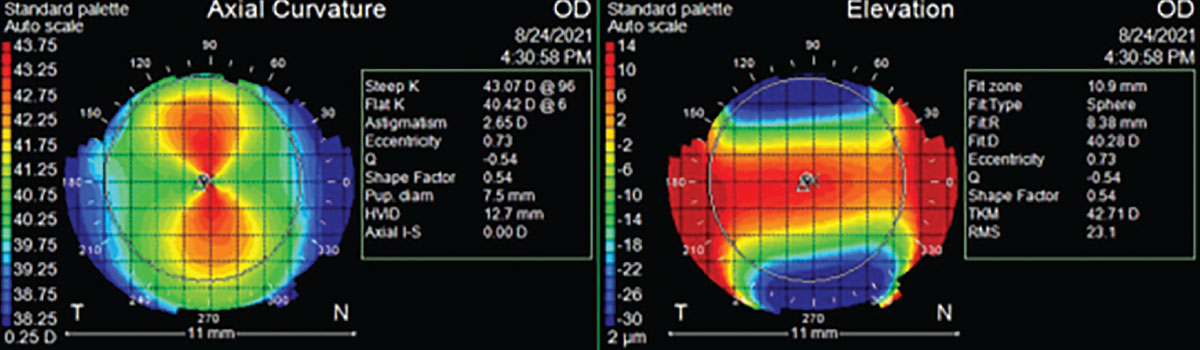
Fig. 4. Axial corneal topography map of keratoconus demonstrating normal Sim K values of the central corneal zone but irregular curvature inferiorly with abnormal symmetry analytics. Click image to enlarge. |
In Placido disc topography, curvature data can be considered as the primary language. It is from this curvature data that algorithms will infer elevation change characteristics relative to a best-fit sphere line. As such, it is fair to think of elevation data like a secondary language in Placido disc topography. Due to this secondary elevation inference, though, Placido disc topography may not be as accurate or sensitive in detection of early pathology as primary elevation measuring technologies (e.g., Scheimpflug tomography, anterior segment OCT and Fourier profilometry); however, it does have its greatest strengths in contact lens fitting. Despite elevation data being calculated from curvature data, the maps may look very different while representing the same corneal shape (Figure 5).
 |
|
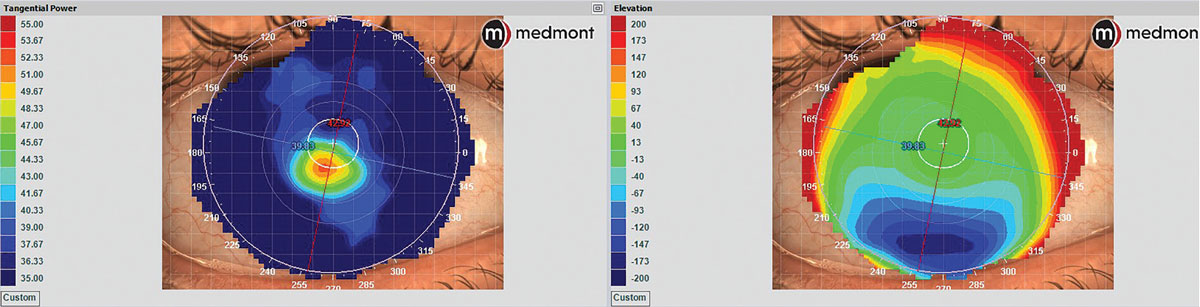
Fig. 5. Placido disc corneal topography of keratoconus showing marked color scale differences and patterns between tangential dioptric power (left) and elevation (right) maps, demonstrating how the same ocular surface will have very different map appearances between curvature and elevation data. Click image to enlarge. |
Of important note, the color patterns for elevation maps and curvature maps are opposite of each other (Figure 6). A flatter curvature meridian, expressed by cooler colors in curvature maps, would be at a greater sagittal height, expressed by warmer colors in elevation maps and vice-versa with the steeper curvature meridian of lower sagittal height. This elevation map color pattern is universal across technologies.1
 |
|
Fig. 6. Corneal topography color scales of axial curvature and elevation maps showing opposite colors per same meridian. Click image to enlarge. |
Projection Corneo-scleral Profilometry
There are other projection-based devices used for ocular surface topography, but the main distinction in these is that, contrary to previously discussed projection devices, they are designed to derive their principal data from sagittal height elevation differences, not curvature. From elevation data, they use algorithms to determine curvature; with these instruments, it is best to think of elevation as their primary language and curvature as secondary. With elevation data, these devices can reconstruct a 3D surface, a technique called profilometry, and since they can obtain data from most of the ocular surface, they are also referred to as corneo-scleral profilometers. There are three main projection-based profilometry technologies: Fourier analysis, triangulation and line scanning.
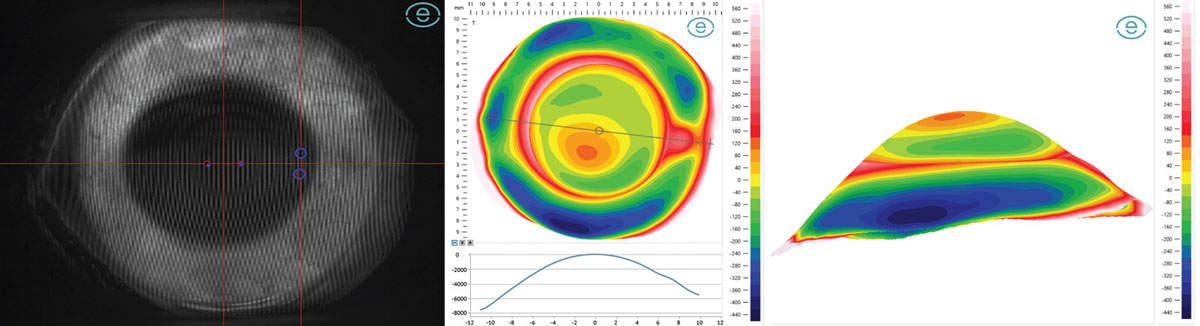
Fourier projection devices have a central camera with two projectors 45° laterally from the center that project overlapping grids onto the fluorescein coated ocular surface, able to image over 20mm in a single image capture with over 500,000 data points (Figure 7).5 Triangulation devices are essentially the opposite—there is a central projector that overlays vertical and horizontal lines onto the fluorescein coated ocular surface and two cameras about 30° laterally displaced that capture three separate images in three positions of gaze, then use triangulation between the two cameras and image stitching to create an ocular surface elevation map.6 Lastly, a slit-scanning device uses one camera and one projector that emits a series of rapidly changing—less than 0.25 seconds—various-spaced vertical line projections over 18mm and also uses triangulation between the projector and camera to form a single profilometry map, either with or without fluorescein.7
 |
|
Fig. 7. Fourier projection grid (left), 20mm profilometry elevation map with meridian profile (center) and three-dimensional reconstruction (right) of eye with keratoconus and pinguecula. Click image to enlarge. |
Elevation data is derived by comparing a best-fit sphere through the corneal points and another through the scleral points (a.k.a. bisphere map). Microns of elevation above and below these respective best-fit spheres are recorded as the profilometry map, with standard warm colors for points higher than the reference line and cooler colors for points lower, with data presented as deviation from the reference line or as total sagittal height. Fourier projection software, uniquely, does not interpolate data points whereas other methods do.
Projection profilometry devices offer a dramatically better representation of 3D modeling of the eye than prior projection topographers but notably are limited to the anterior surface only and therefore are likewise not as sensitive in detecting early pathology as devices that image the posterior cornea. Corneo-scleral profilometry is particularly valuable in scleral lens fitting for both simple and complex ocular geographies.
Ocular Impression
 |
|
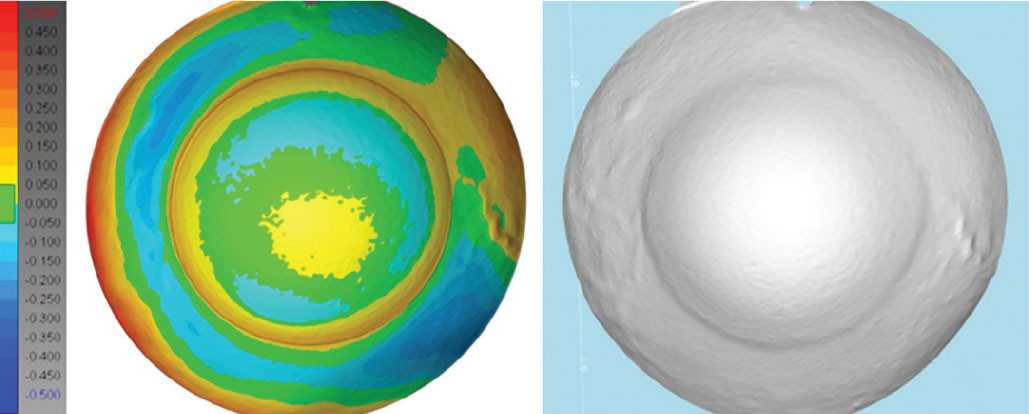
Fig. 8. Ocular impression elevation map and 3D scan of impression of eye with prominent vasculature. Photo: Christine Sindt, OD. Click image to enlarge. |
Arguably the most reliable way of obtaining elevation data is by physical ocular impression of the ocular surface with polyvinylsiloxane material and subsequent 3D scanning of the impression (Figure 8). This technology can obtain up to 26mm of corneal and scleral data. Provided steady patient fixation and application technique, it may be superior to projection or scan-based technologies because it eliminates potential artifacts caused by tear film dryness and lash shadowing, and can obtain data otherwise obstructed, such as under the lids. Elevation color maps and 3D reconstruction are possible as well.8
This method is less common than projection or scan-based measurements due to practitioner training and skill, materials costs and longer process duration compared to image acquisition technologies. The ocular surface impressions likewise do not obtain posterior corneal data and have their greatest strength in fitting scleral lenses for any ocular geography and for eyes in which data cannot be reliably obtained by optical methods.
Topography vs. Tomography: What's in a Name?Both modalities are used to understand the landscape of the cornea. Topography is the understanding of the curvature or elevation of a surface, while tomography penetrates through the scanned surface area to create an entire structural map. Corneal topography will give added data such as tear film performance and the imaging and measurements needed to evaluate contact lens front surface optics (e.g., multifocal). Corneal tomography will give added data of corneal opacity density, global pachymetry, as well as structural data of the anterior chamber, iris and crystalline lens. |
Corneal Tomography
Tomography is the mapping and reconstruction of an area using slices through said structure. This technology is foundational in our modern evaluation of the posterior segment, but in recent years has also become foundational in our evaluation of the anterior segment from the cornea, sclera, anterior chamber to crystalline lens. Anterior segment OCT (AS-OCT) and Scheimpflug tomography use scanning technology to map elevation points of the corneo-scleral ocular surface as well as posterior corneal elevation, by which corneal thickness maps are derived.
Like profilometry, tomography’s primary language is in elevation, with curvature data secondarily calculated, but its ability to scan and map the entire cornea makes these devices more sensitive to early and subtle structural changes of the cornea, therefore making it preferred for pathology detection and monitoring.
 |
|
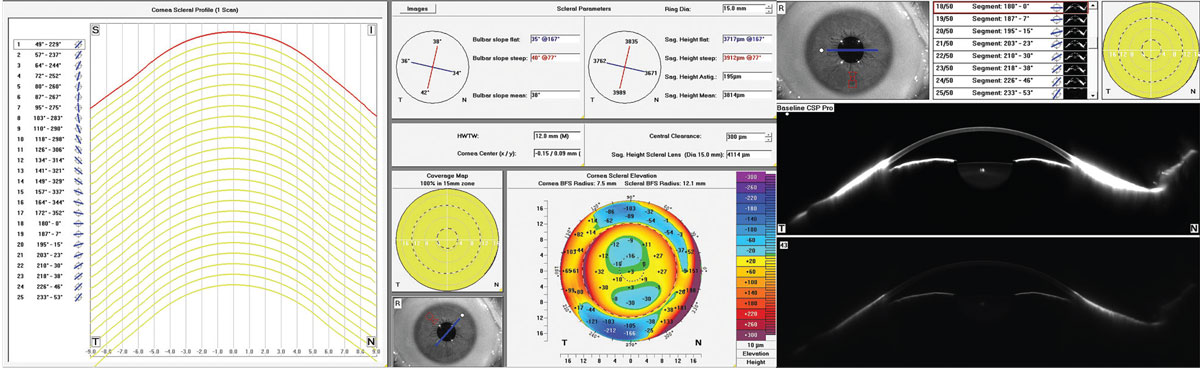
Fig. 9. Scheimpflug tomography with corneo-scleral profilometry elevation map and anterior segment imaging. Click image to enlarge. |
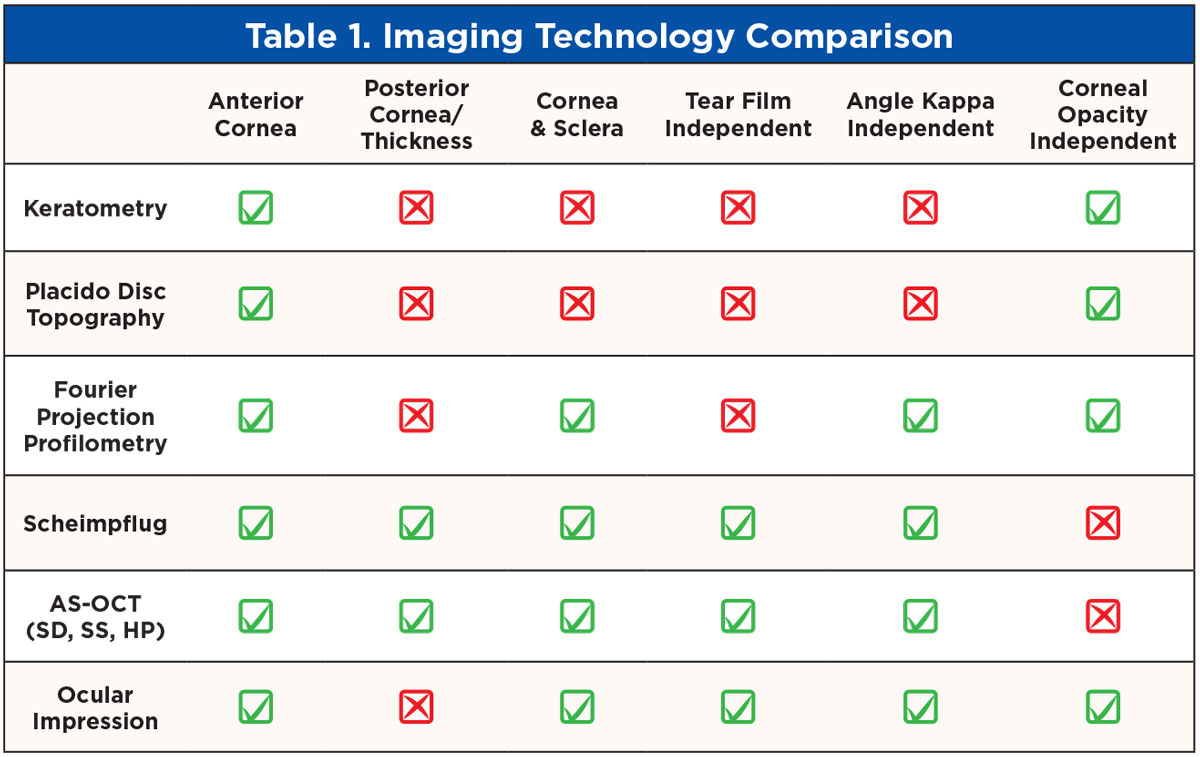
Scheimpflug tomography combines a rotating camera with a slit beam and a static camera to measure over 25,000 elevation data points of both front and back corneal surfaces as well as the sclera and anterior segment (Figure 9).9 AS-OCT can be categorized by increasingly high-resolution imaging. Spectral-domain OCT uses about 25,000 A-scans/second, swept-source OCT about 50,000 A-scans/second and new hyper-parallel OCT over 300,000 A-scans/second to reconstruct the anterior segment.10,11 Like the profilometry data, the elevation maps are compared to a best-fit sphere line to create microns of elevation data represented in deviation to reference line or in total sagittal height. With this ability to obtain anterior elevation, thickness and posterior elevation data, more sophisticated and comprehensive algorithmic symmetry and ectasia analytics are possible and a more complete representation of the eye is obtained. Table 1 outlines specific features of each technology.
 |
| Click image to enlarge. |
Curvature Past, Elevation Present
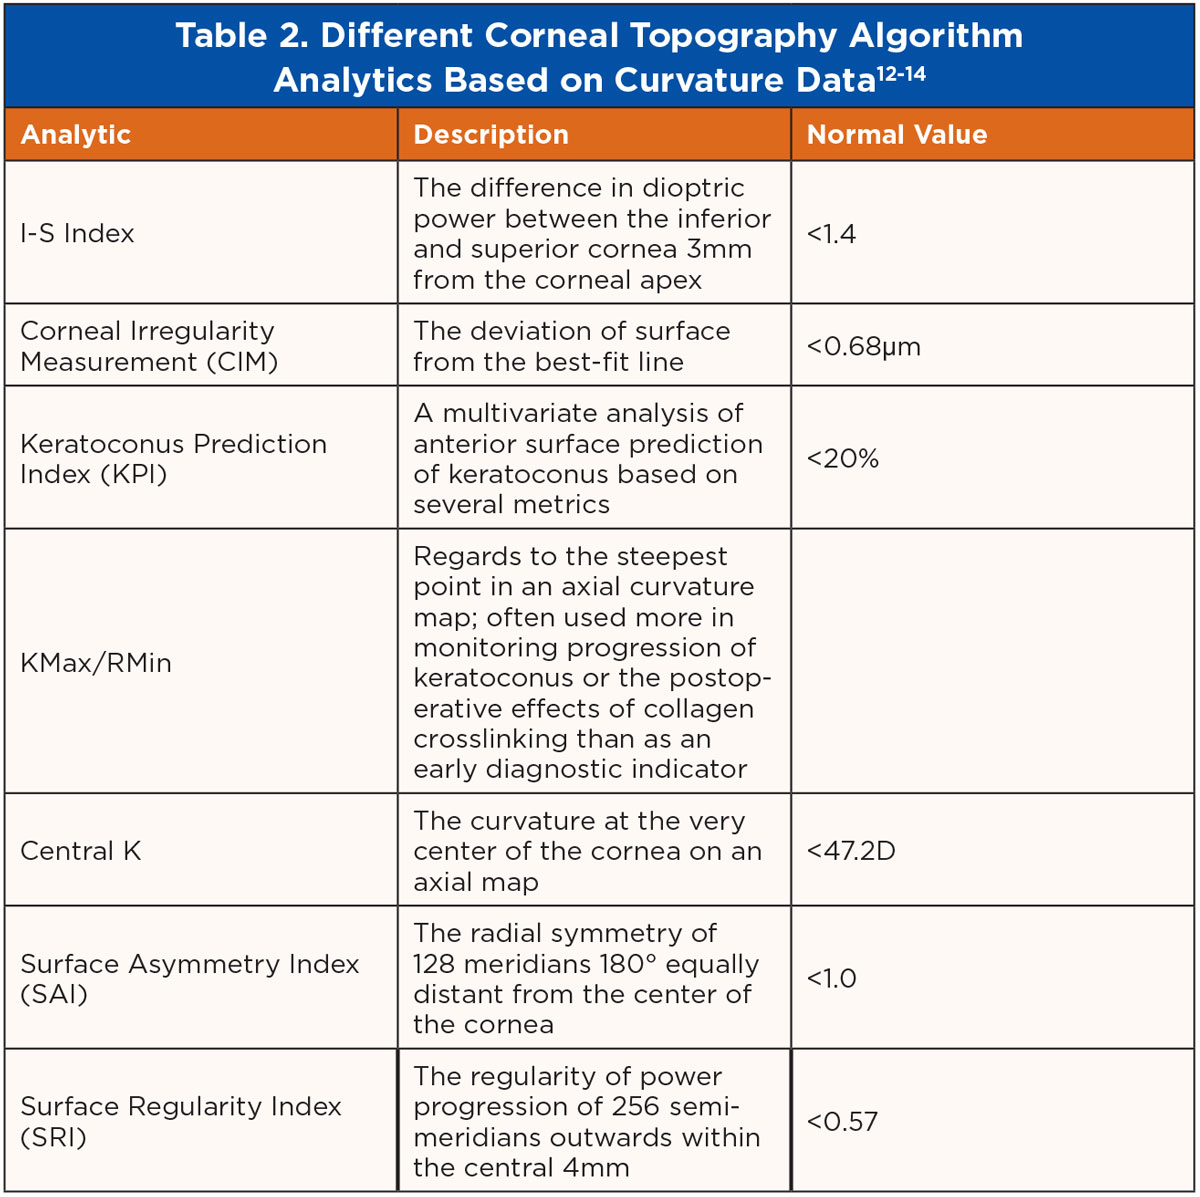
Regarding corneal evaluation, there have been many helpful algorithm analytics based on curvature data within corneal topography systems. Some of the most common include I-S Index, CIM, KPI, KMax/RMin, Central K, SAI and SRI among others, with their descriptions and typical values outlined in Table 2.
 |
| Click image to enlarge. |
With the rise of these sagittal height elevation-based technologies, more sensitivity to corneal structural changes and variation from normative databases can be detected over time. As we know, keratoconus presents first in the posterior cornea, often years before it may be apparent on the anterior cornea.15
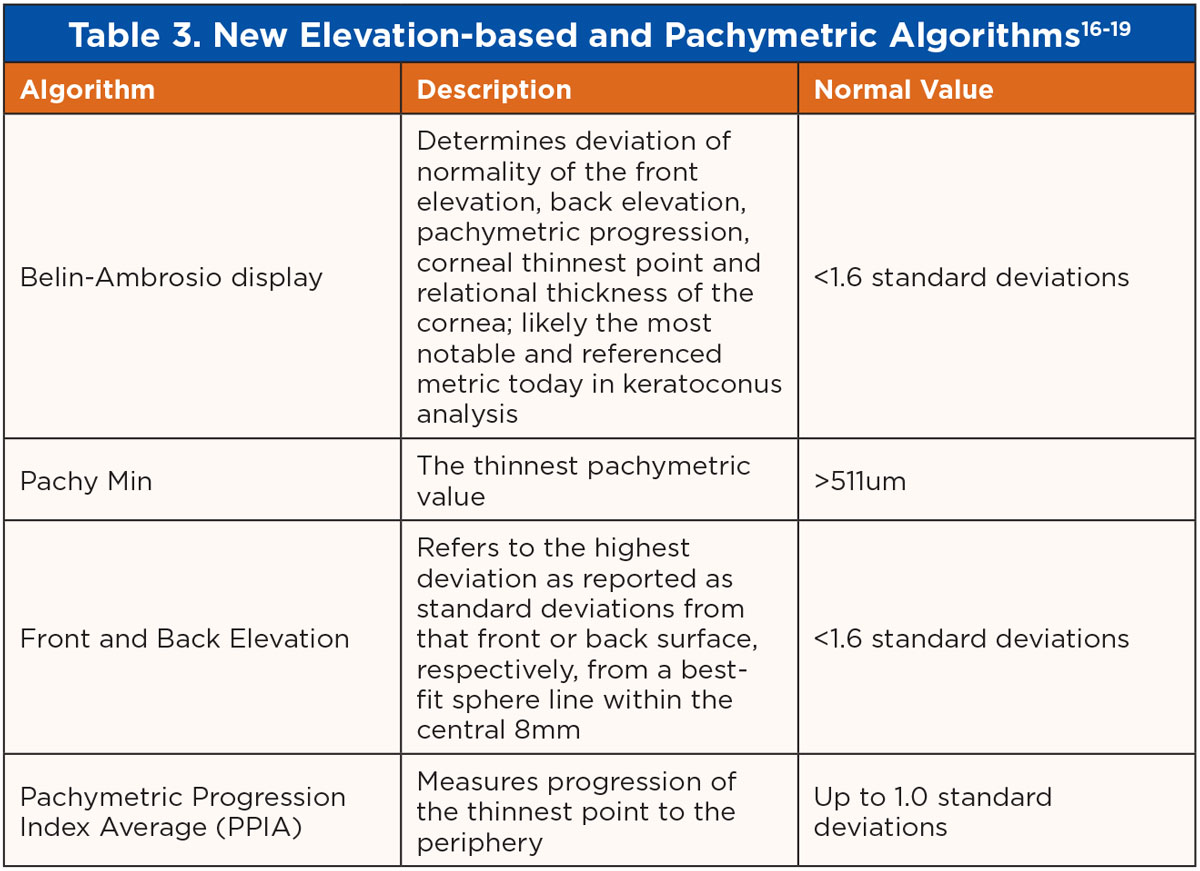
New elevation-based and pachymetric algorithms may soon be the standard in ectasia prediction and detection, including the Belin-Ambrosio display, front elevation and back elevation, pachymetric minimum and pachymetric progression index average outlined in Table 3. Belin-Ambrosio ectasia analysis is displayed in Figure 10.
 |
| Click image to enlarge. |
 |
|
Fig. 10. Scheimpflug tomography elevation-based Belin-Ambrosio ectasia analysis showing mild keratoconus. Click image to enlarge. |
Illuminating Cases
The following are a series of examples where what we may assume to be true about the ocular surface based on corneal curvature data proves to be misleading:
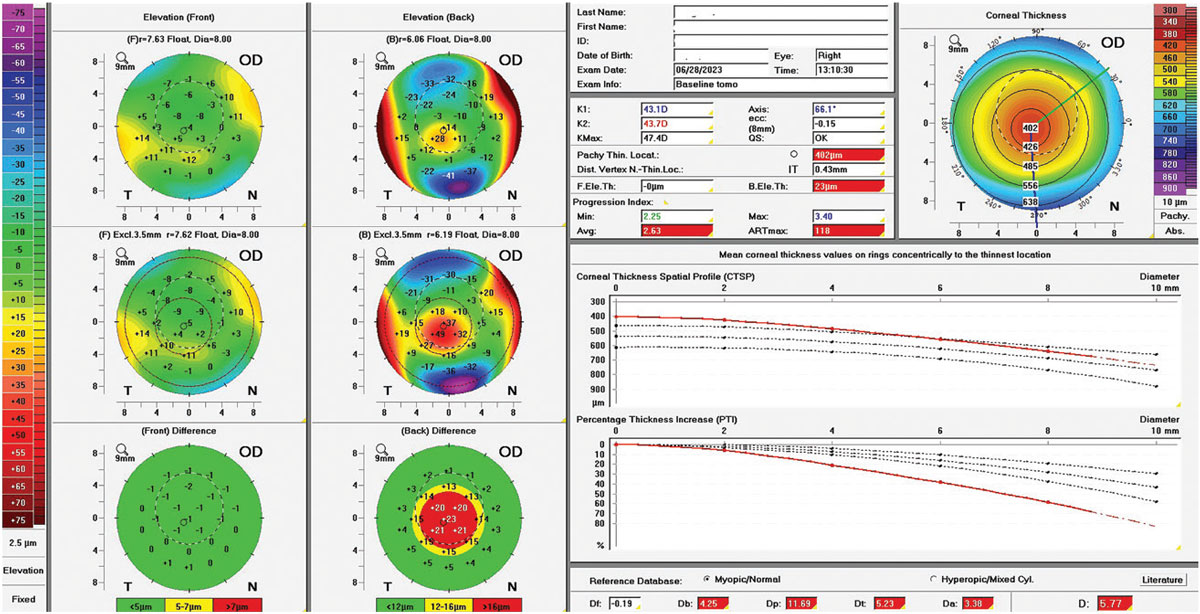
Case 1. This is an example of severe keratoconus with a KMax of 99D, a max front elevation deviation of around 100µm above best-fit sphere, a minimum pachymetry of 201µm and a Belin-Ambrosio display over 45 standard deviations. As demonstrated by gross observation and Scheimpflug tomography imaging, this corneal shape is severely warped (Figure 11), so it stands to reason to expect the sclera to be similarly severely warped.
 |
|
Fig. 11. Severe keratoconus with extreme corneal shape irregularities yet very normal scleral shape with near spherical properties irrespective of corneal properties, as imaged by Fourier projection profilometry, Scheimpflug tomography, lateral observation and impression. Click image to enlarge. |
Although this is a severe case of corneal elevation abnormalities, the sclera has a very minimal 100µm of toricity at a 15mm chord. A chord of 15mm is a useful diameter to measure scleral toricity because it coincides within the scleral landing zone of most scleral lenses and is easily and reliably measured by all profilometry devices. At a 15mm chord, studies have found the average scleral angle to range between 35° to 38°.20
Despite this patient’s severe keratoconus steepening and elevation, they had a very normal average scleral angle of 38° at the 15mm chord; this demonstrates that elevation shape patterns of the cornea do not necessarily carry over into the shape of the sclera in all cases. This discovery was made possible by elevation-based imaging.
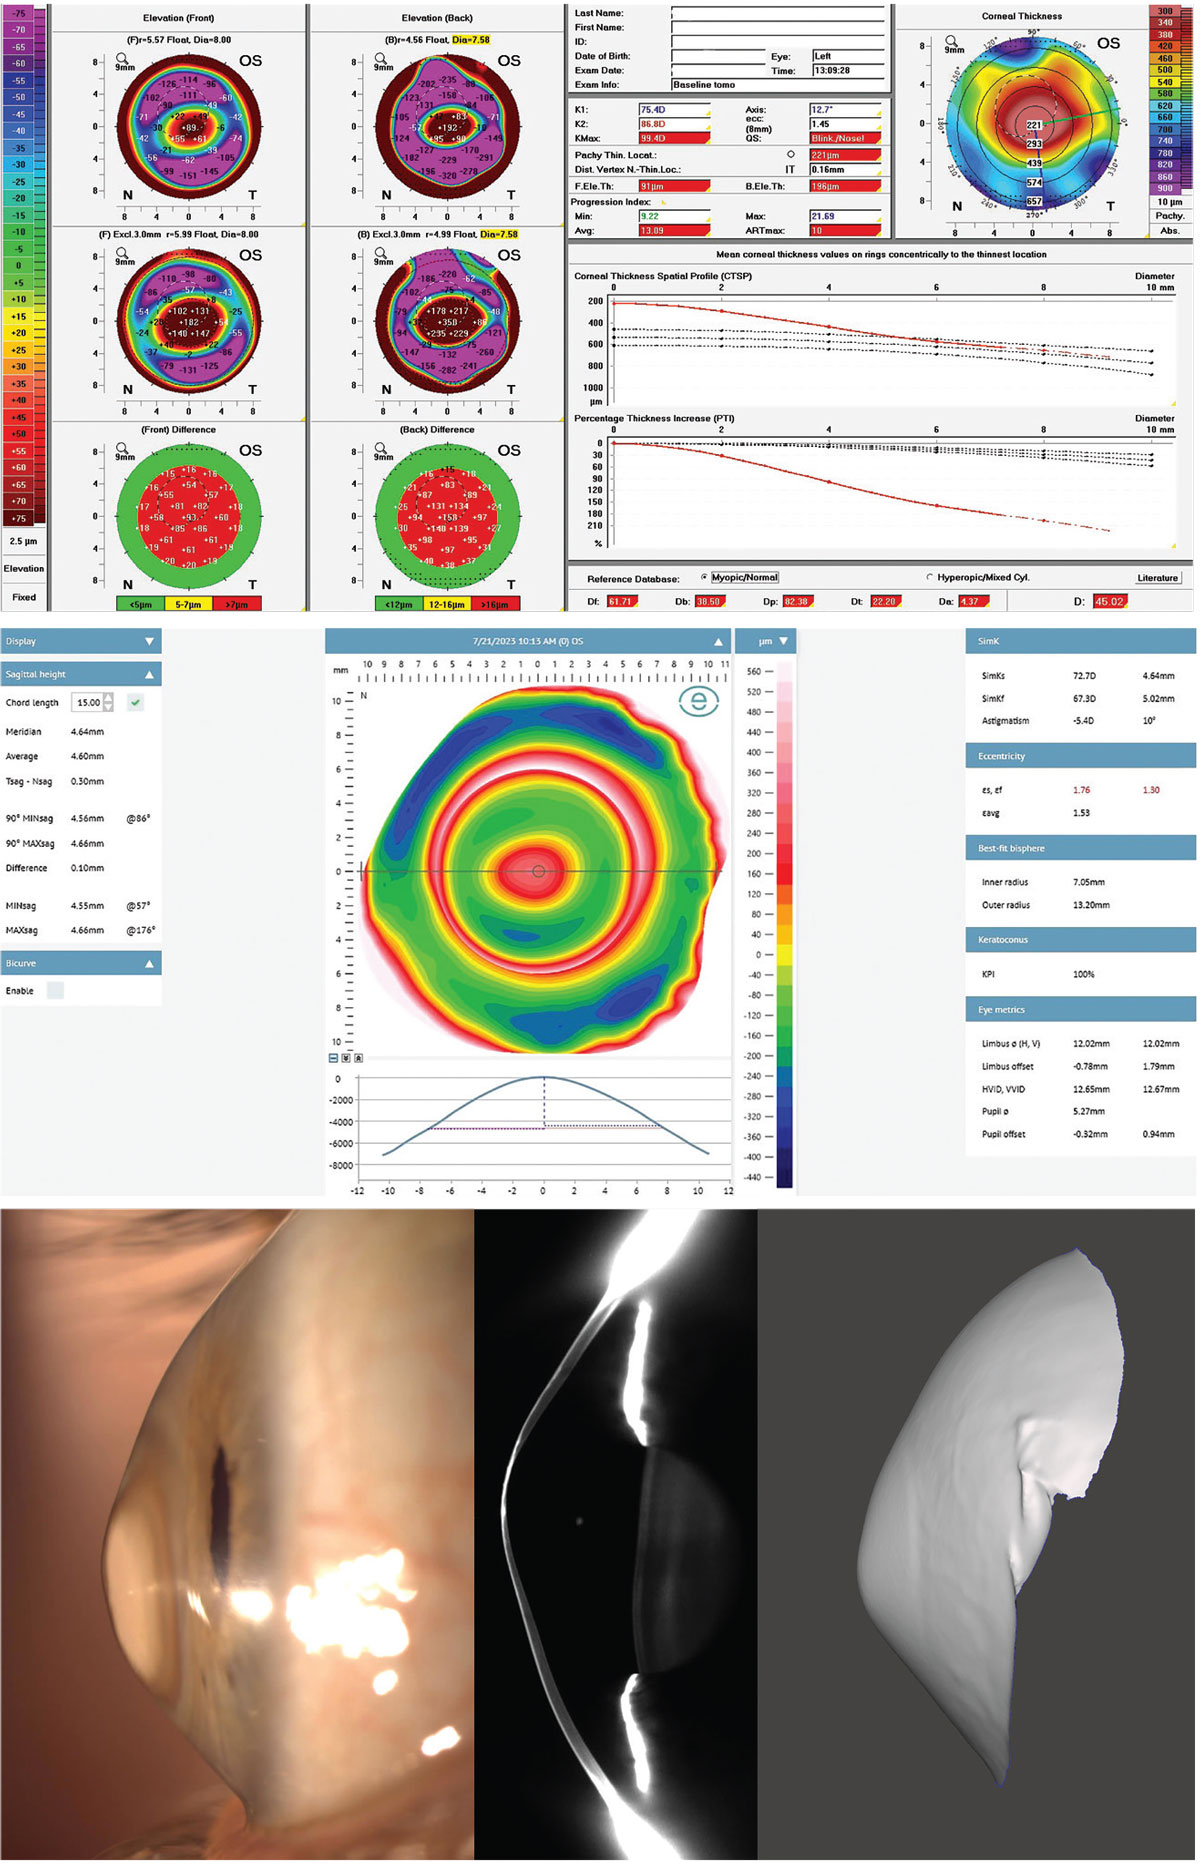
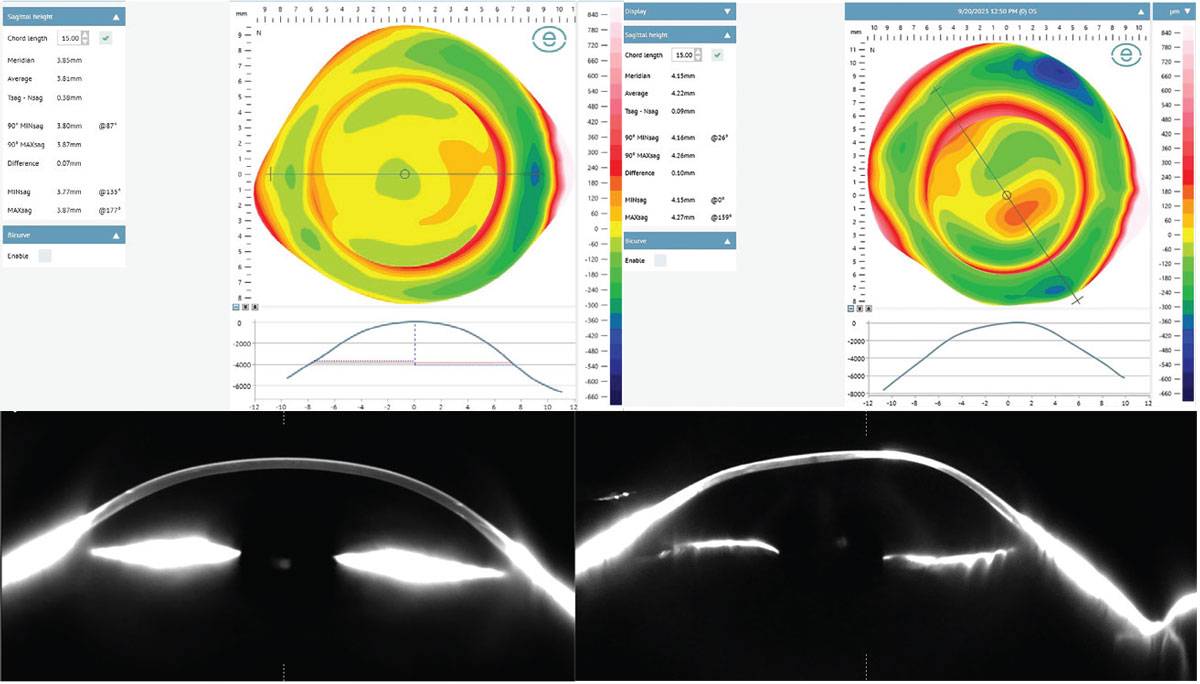
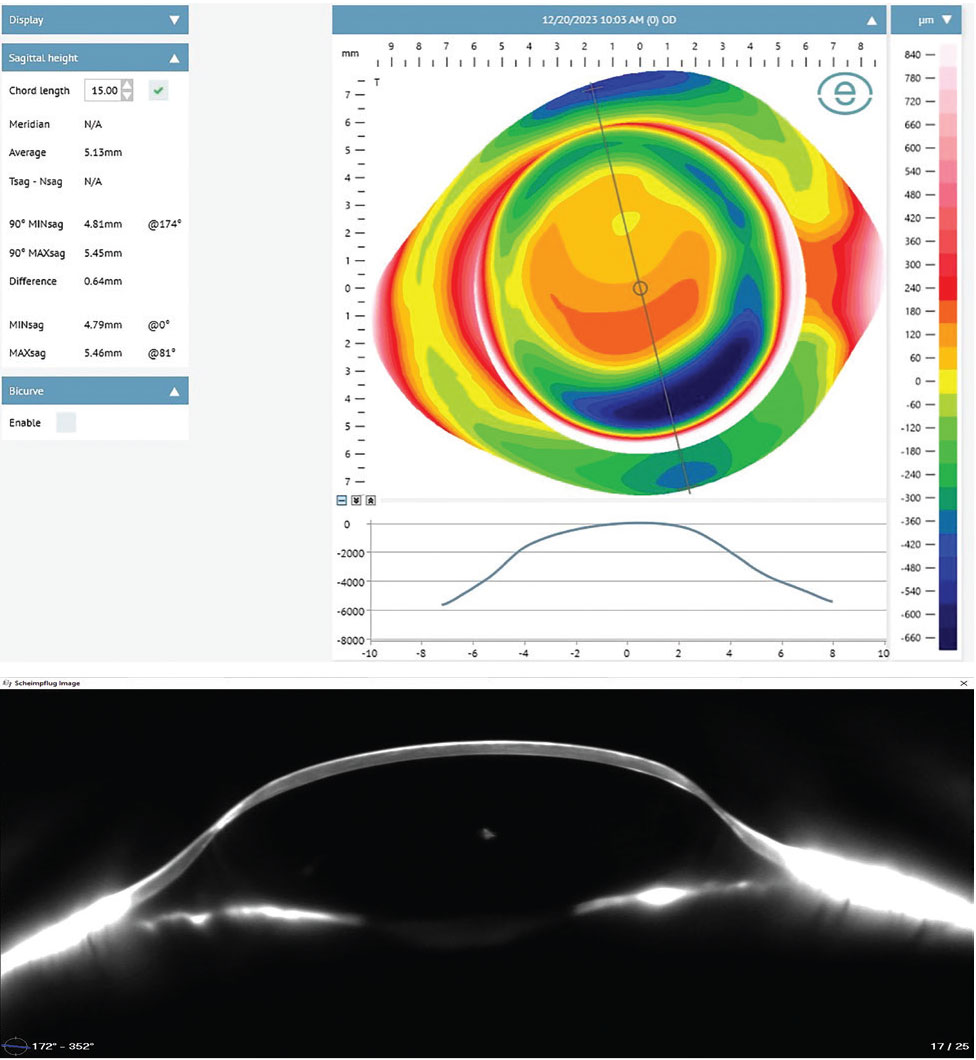
Case 2. Curvature data does not necessarily correlate with sagittal depth (Figure 12). Each of the following corneas are similarly shaped with more oblate profiles, having mean Ks ranging from 36D to 44D. However, each one has a markedly different overall ocular shape and elevation profile. Patient A has a mean K of 36D with a mean sagittal height at 15mm of 3,810µm. Patient B has a similar mean K of 42D but with a significantly higher mean sagittal height at 15mm of 4,220µm. Patient C also has a similar mean K of 44D but with a drastically higher mean sagittal height at 15mm of 5,130µm.
All three corneas look quite similar by topographical curvature data standards, yet they have an almost 40% variance in height between them, again demonstrating that assumptions in ocular shape based on curvature topography has little value and only with elevation-based imaging can each eye be assessed individually. In Figure 12, notice how precisely the profilometry profile beneath each elevation map correlates to the Scheimpflug tomography slice at the same meridian, confirming the accuracy of profilometry in representing ocular shape.
 |
|
Fig. 12a. Patients A and B demonstrate similar corneal curvatures but with different sagittal heights. Corneo-scleral profilometry map, meridian profile simulation and actual meridian profile as imaged with Fourier projection profilometry and Scheimpflug tomography, respectively. Click image to enlarge. |
 |
|
Fig. 12b. Patient C demonstrates similar corneal curvatures to Patients A and B but with a drastically higher mean sagittal height. Click image to enlarge. |
Takeaways
As Heraclitus observed, “the only constant in life is change,” and that is certainly the case in optometry today. Thinking about the cornea in terms of curvature is of little use to describe ocular shape, contrary to prior assumptions. Elevation-based topographical data is the only true way to achieve a full picture for managing the refractive and ocular health of our patients to the best of our ability.
For those who have the technology in your clinic to map the cornea with Placido disc topography, I would encourage you to start looking carefully at those elevation maps alongside your usual routine of axial and tangential maps and look carefully at your anterior curvature symmetry metrics.
Those practitioners who have elevation-based instruments may be at an advantage in gaining a more comprehensive picture of the ocular surface anatomy. Particularly for elevation-based tomography technology, this appears to be the standard for which ocular shape, corneal thickness, corneal pathology detection and treatment will be conducted for the foreseeable future.
For those who have not yet adopted these technologies in your practice, I’d encourage you to hop on board or risk getting left behind.
Dr. Wolf, FAAO, FSLS, FIAOMC, received his Doctor of Optometry from the University of Houston in 2009. He is the owner of the private practice Austin Optometry Group in Austin, TX, focusing on ocular surface disease and specialty contact lenses, including scleral lenses and orthokeratology. Dr. Wolf provides topography-guided and tomography-guided corneal, scleral and orthokeratology lenses, ocular impression-based lenses and custom HOA-correcting lenses. He is the first doctor in Texas to earn all the following clinical fellowships: Fellow of the American Academy of Optometry, Fellow of the Scleral Lens Society and Fellow of the International Academy of Orthokeratology and Myopia Control. He has served as a speaker, consultant or provided case reports for Eaglet Eye, Medmont Intl., Oculus Wave, Ovitz, EyeXY and Acculens.
1. Gurnani B, Kaur K. Keratometer. In: StatPearls. Treasure Island (FL): StatPearls Publishing. June 11, 2023. 2. Sridhar U, Tripathy K. Corneal topography. In: StatPearls. Treasure Island (FL): StatPearls Publishing. Updated September 4, 2023. 3. Kanclerz P, Khoramnia R, Wang X. Current developments in corneal topography and tomography. Diagnostics (Basel). 2021;11(8):1466. 4. Fadel D. Medmont Meridia: much more than a corneal topographer. Clin Optom (Auckl). 2023;15:283-301. 5. Bandlitz S, Esper P, Stein M, Dautzenberg T, Wolffsohn JS. Corneoscleral topography measured with Fourier-based profilometry and Scheimpflug imaging. Optom Vis Sci. 2020;97(9):766-74. 6. DeNaeyer G, Sanders DR. sMap3D corneo-scleral topographer repeatability in scleral lens patients. Eye Contact Lens. 2018;44 Suppl 1:S259-64. 7. Zou Y, Niu L, Su B, Sun Y, Liu J. Calibration of 3D imaging system based on multi-line structured-light. Proc. 2018;10845(108450C). 8. Sclafani L, Slater D, Lay B, Sindt CW. Topographic elevation data to design scleral lenses. Invest Ophthalmol Vis Sci. 2017;58(8):3550. 9. Ambrósio R Jr, Lopes BT, Faria-Correia F, et al. Integration of Scheimpflug-based corneal tomography and biomechanical assessments for enhancing ectasia detection. J Refract Surg. 2017;33(7):434-43. 10. Asam JS, Polzer M, Tafreshi A, Hirnschall N, Findl O. Anterior segment OCT. 2019. In: Bille JF, editor. High resolution imaging in microscopy and ophthalmology: new frontiers in biomedical optics. Cham (CH): Springer; 2019. Chapter 13. 11. Frisken S, Anderson T, Segref A, Lorenser D, Frisken G. Anterior and posterior imaging with hyperparallel OCT. Biomed Opt Express. 2023;14(6):2678-88. 12. Rabinowitz YS, Rasheed K. KISA% index: a quantitative videokeratography algorithm embodying minimal topographic criteria for diagnosing keratoconus. J Cataract Refract Surg. 1999;25(10):1327-35. 13. Cavas-Martínez F, De la Cruz Sánchez E, Nieto Martínez J, Fernández Cañavate FJ, Fernández-Pacheco DG. Corneal topography in keratoconus: state of the art. Eye Vis (Lond). 201:3:5. 14. Gomes JAP, Tan D, Rapuano CJ, et al. Group of Panelists for the Global Delphi Panel of Keratoconus and Ectatic Diseases. Global consensus on keratoconus and ectatic diseases. Cornea. 2015;34(4):359-69. 15. Khachikian SS, Belin MW. Posterior elevation in keratoconus. Ophthalmology. 2009;116(4):816, 816.e1; author reply 816-7. 16. Doctor K, Vunnava KP, Shroff R, et al. Simplifying and understanding various topographic indices for keratoconus using Scheimpflug based topographers. Indian J Ophthalmol. 2020;68(12):2732-43. 17. Belin MW, Duncan JK. Keratoconus: the ABCD grading system. Klin Monbl Augenheilkd. 2016;233(6):701-7. 18. Ambrósio R Jr, Caiado ALC, Guerra FP, et al. Novel pachymetric parameters based on corneal tomography for diagnosing keratoconus. J Refract Surg. 2011;27(10):753-8. 19. Villavicencio O, Belin MW, Ambrósio R Jr, Steinmueller A. Corneal pachymetry: new ways to look at an old measurement. J Cataract Refract Surg. 2014;40(5):695-701. 20. Ritzmann M, Caroline PJ, Börret R, Korszen E. An analysis of anterior scleral shape and its role in the design and fitting of scleral contact lenses. Cont Lens Anterior Eye. 2018;41(2):205-13. |