In the March/April issue, the article “Corneal Topography: Get to New Heights” discussed the purpose of corneoscleral elevation data and the currently available technologies. In this second part and conclusion to the discussion, corneoscleral elevation focus shifts will be covered and how to incorporate this data into useful daily practice will be reviewed. Of course, elevation of the cornea, particularly the posterior cornea, is of paramount interest in screening and monitoring keratoconus and similar ectasias, but perhaps an even more practical usage of sagittal elevation data can be applied to what eyecare practitioners perform every day: contact lens (CL) fittings.
The landscape of the contact lens industry is changing, with more manufacturers adopting an elevation-based approach—particularly with specialty lenses, such as corneal rigid gas-permeable (GP) lenses, scleral lenses and orthokeratology (ortho-K) lenses. Even commercial soft contact lenses are revealing insightful evidence pointing to elevation data being the key to a predictably successful, empirical lens design.
Corneal GP Lenses Set the Stage
For most of the 20th century, rigid contact lenses were the only CL option. Over time, hard polymethylmethacrylate (PMMA) lenses eventually gave rise to flexible, more oxygen-transmissible GP materials, but they were still rigid in shape—thus needing to be fit as predictably similar to the corneal shape as was measurable at the time.
In those early years, fitting could be based on adjusting your GP fit to match in-situ CL characteristics from a set of diagnostic lenses or by measuring the curvature of the central cornea from keratometry to arrive at a well-aligned lens curvature more quickly. The overall diameter (OAD) tended to hover around 75% of corneal size, making a typical lens OAD between 8.0mm and 9.5mm. This proved to be a successful size range because most of the central base curve (BC) of the CL could be adequately fitted from very limited central cornea measurements of keratometry; these smaller lenses provided more tear exchange that was necessary for oxygen transmission (Dk) for the low Dk materials of the time.
Enough was known and observable about peripheral corneal eccentricity that one or multiple progressively flatter peripheral curves could be incorporated to provide an ideal lens fit to a presumably normal cornea; however, without the means of the time to directly measure the peripheral corneal topography—which can be increasingly unpredictable and asymmetric—larger lenses risked corneal binding. Thus, fitting methods in general were more reactive than proactive.
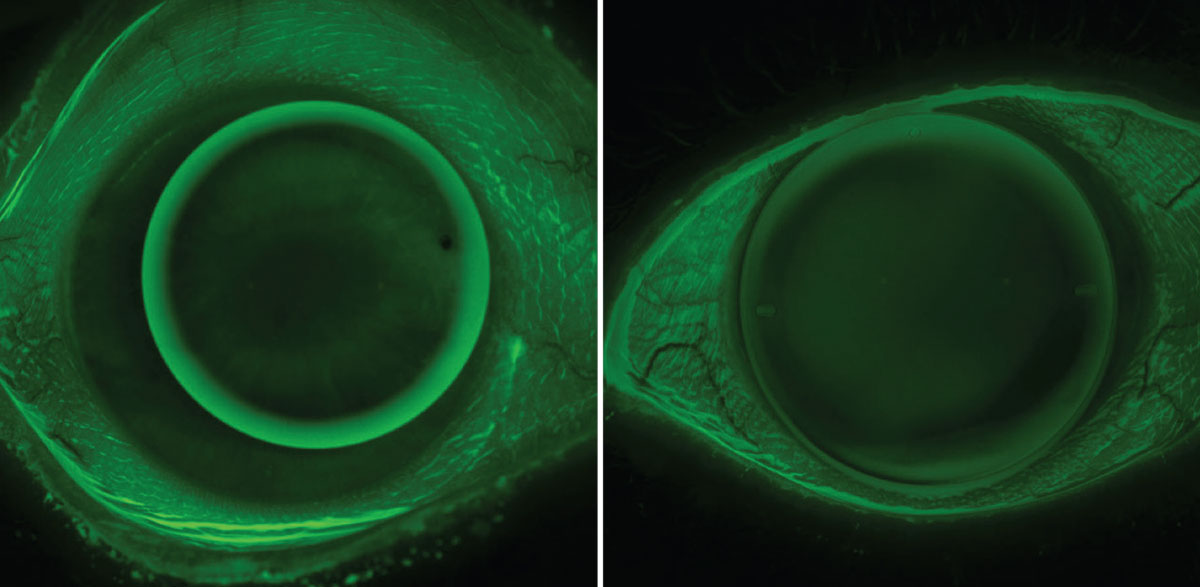
The arrival of subsequent projection-based topography and tomography instruments (discussed in Part 1) provided a much greater area of the cornea capable of being measured with precision, leading to dramatically improved predictability of central and peripheral lens alignment. Along with the advancements in greater Dk materials, a trend in larger corneal GP lenses, or intralimbal lenses, evolved, whereby the OAD may be precisely designed upwards of 85% to 95% of the cornea’s size (Figure 1). These larger corneal GP lenses can provide greater lens stability that is advantageous for advanced optics such as multifocal or toric correction due to improved lens centration and generally less lens awareness by decreasing the amount of lens movement.
 |
|
Fig. 1. Traditional small OAD corneal GP lens (left) and modern intralimbal GP lens (right). Intralimbal lenses may have advantages in centration, stability, comfort and optics. Click image to enlarge. |
With today’s advancements in the ability of corneal imaging technology to measure the entire cornea—out to the limbus or beyond—with great precision, it has become easier than ever to accurately design intralimbal GP lenses even to very irregular corneal geographies.1 As discussed in Part 1 in the March/April issue, with these improved technologies came the transition from corneal curvature metrics as the leading data source to that of sagittal elevation data, which is not only a better representation of ocular surface shape but also ties more directly to modern manufacturing technology.
Some topographers include computer-aided design (CAD) and computer-aided manufacturing (CAM) software either internally or externally linked to the topography map for the ability of the practitioner to design a truly custom lens; this allows them greater ability to use their preferred fitting philosophy combined with clinical information not always revealed by the map, such as eyelid anatomy, conjunctival obstacles or dexterity challenges. Then, that design file is sent directly to a lathe for manufacturing.
Figure 2 shows examples of various internal and external corneal GP design CAD/CAM software. Notice that the lens design and fluorescein fit simulations record the tear film thickness (TFT) and lens sagittal depth (SAG) values in microns, offering more customization to alter a greater number of control points on the lens. Below is a case demonstrating the usefulness of this technology when dealing with distorted or challenging corneas.
 |
|
Fig. 2. CAD/CAM corneal GP software with in-situ fluorescein simulation from internal Medmont software, internal Pentacam software and external Eaglet Eye export to Wave software. Click image to enlarge. |
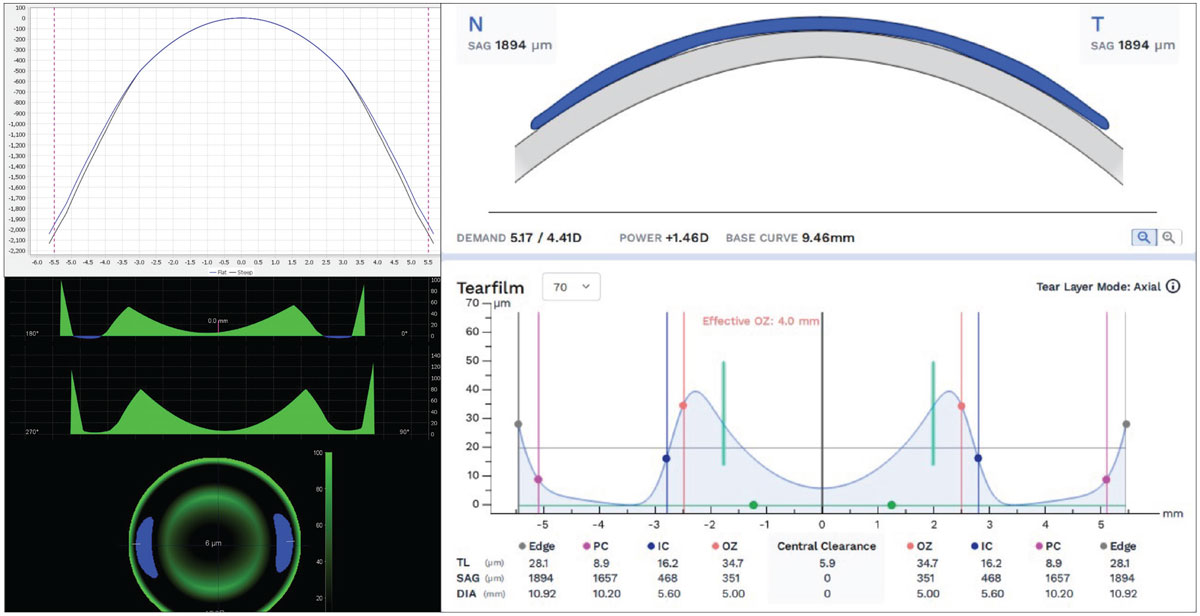
Case 1. A patient with a penetrating keratoplasty corneal transplant often provides a very irregular corneal surface and is a challenging fit for any practitioner. The extreme precision of the corneal tomography (Oculus Pentacam AXL Wave) map of the corneal front surface out to the limbus as well as the ability to create a freeform GP lens both contribute so that many variable elevation points can be controlled individually and are on full display. As demonstrated in Figure 3, not only is a satisfactory fit on a very challenging and distorted cornea made possible, but the accuracy of the elevation maps and in-situ fluorescein pattern are nearly mirror images of each other and closely predicted by the TFT-simulated pattern of the design software (Wave Contact Lens System). On the elevation map, warmer colors are higher and cooler colors are lower, precisely transferring to the areas of mild touch on the highest elevation points and greatest fluorescein depth over the areas of lowest elevation.
 |
|
Fig. 3. Pentacam tomography front elevation map (top left), freeform Wave intralimbal GP showing fluorescein pattern mimicing elevation map (top right) and Wave CAD/CAM software showing simulated TFT at the horizontal meridian (bottom). Click image to enlarge. |
Elevation Data in Soft CL Fitting
With the market domination of soft CLs in the second half of the 20th century, the demand for fitting GP lenses largely reduced; the pliable lens material was much more forgiving in achieving comfortable alignment to the average eye. This pliability of soft lenses explains why the BC of commercial soft lenses—typically averaging around 8.5mm—is so significantly different than the mean K of most corneas they are fitted to—which average closer to 7.5mm.2 Manufacturers can anticipate the conformity and laxity of the lens based on their designed polymer and selected BC and OAD, allowing the lens to align to the greatest number of normal corneas.3
Although this approach is quite successful in most regular cornea patients, it is not a customized approach and will not always yield optimal results even in healthy and predictable corneal anatomies. Likely these effects are multivariable, from factors of lens polymer, water content, corneal diameter, OAD, lens power, lens dehydration and even manufacturing inconsistencies. Another major contributing factor is something discussed even less—corneoscleral sagittal elevation height. Perhaps elevation data could prove to be a more predictable measure to anticipate successful CL fitting than corneal keratometry.
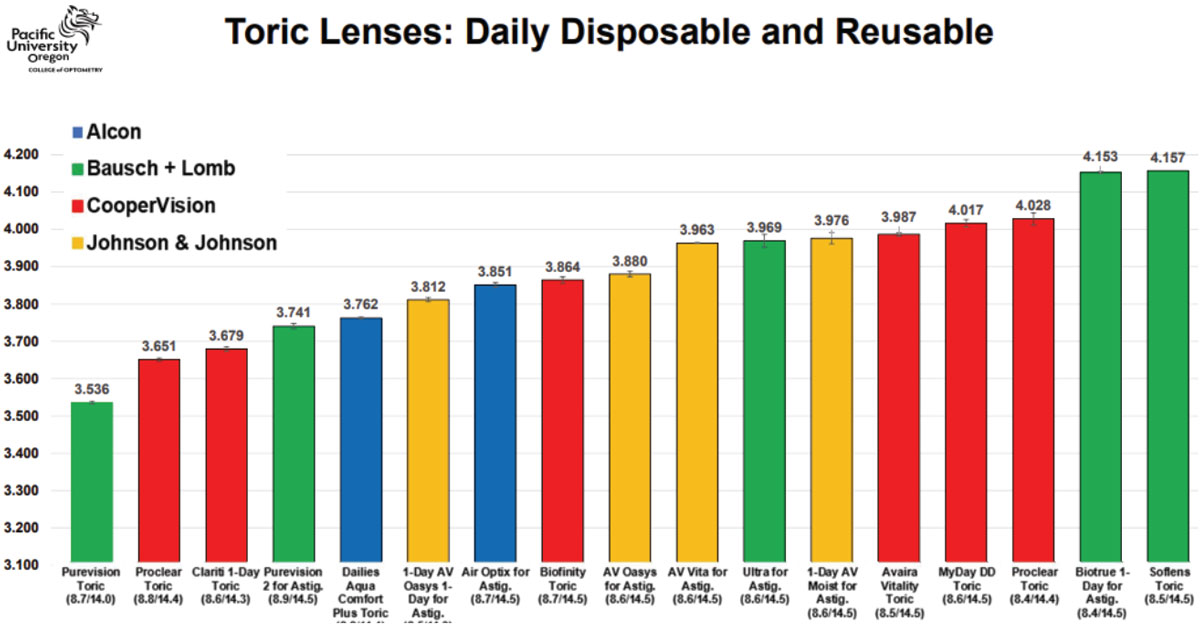
Research by Eef van der Worp et al. has shown interesting results when studying the fitting effects of silicone hydrogel lenses of shared BC and power. They found that, despite similar parameters, there were marked differences in sagittal height among the lenses in both daily disposable or reusable lenses and spherical or toric lens designs, differing sometimes dramatically by several hundred microns.3 This is incredibly illuminating—for decades, the approach to selecting an initial soft CL has been based on keratometry (Ks) and more so mean or mid-K.
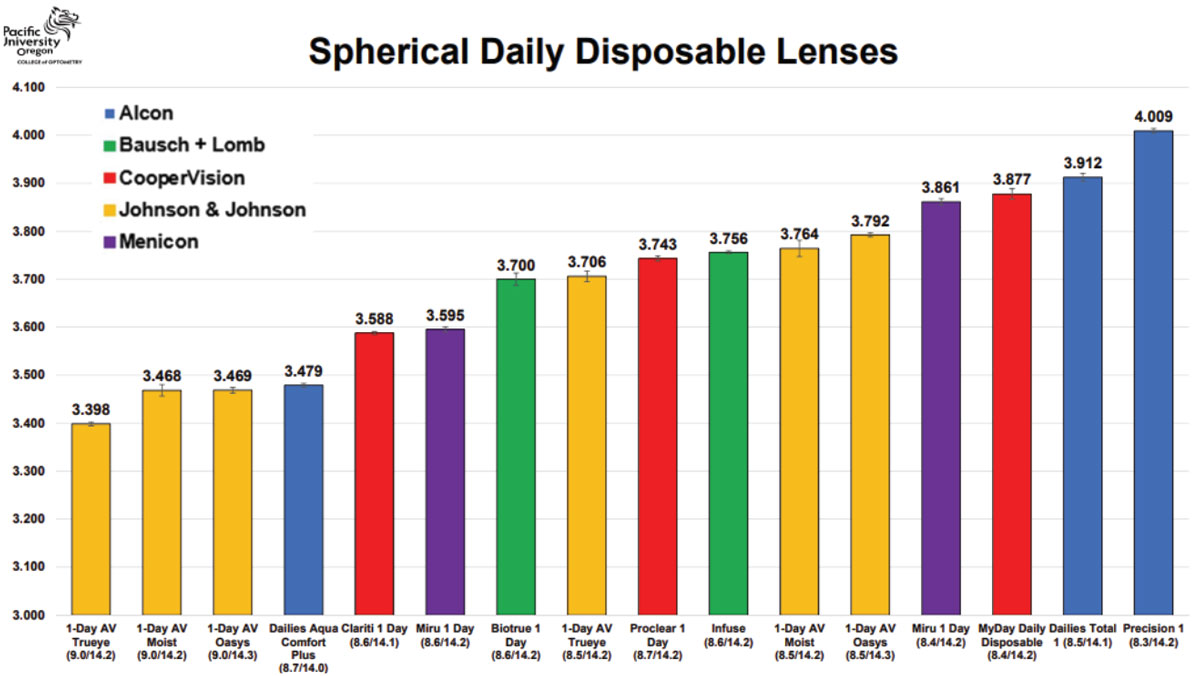
Another consideration was if the lens proved to be fitting too tight or loose. In these cases, it was advised by manufacturer recommendations and conventional practices to then select a flatter or steeper BC, respectively. This may be a misguided approach. Instead, with known corneoscleral sagittal height information, purposefully targeting another soft CL product altogether could be the faster and easier route to a better fitting lens. Using Tables 1, 2 and 3 and directly measured or estimated sagittal height data from various corneal topographers, a more personalized approach to contact lens fitting can be achieved dependent on each eye’s characteristics. The cases below use these tables to illustrate their value.
 |
|
Table 1. Sagittal height reference for daily disposable spherical soft CLs. Images: Pacific University College of Optometry. Click image to enlarge. |
 |
|
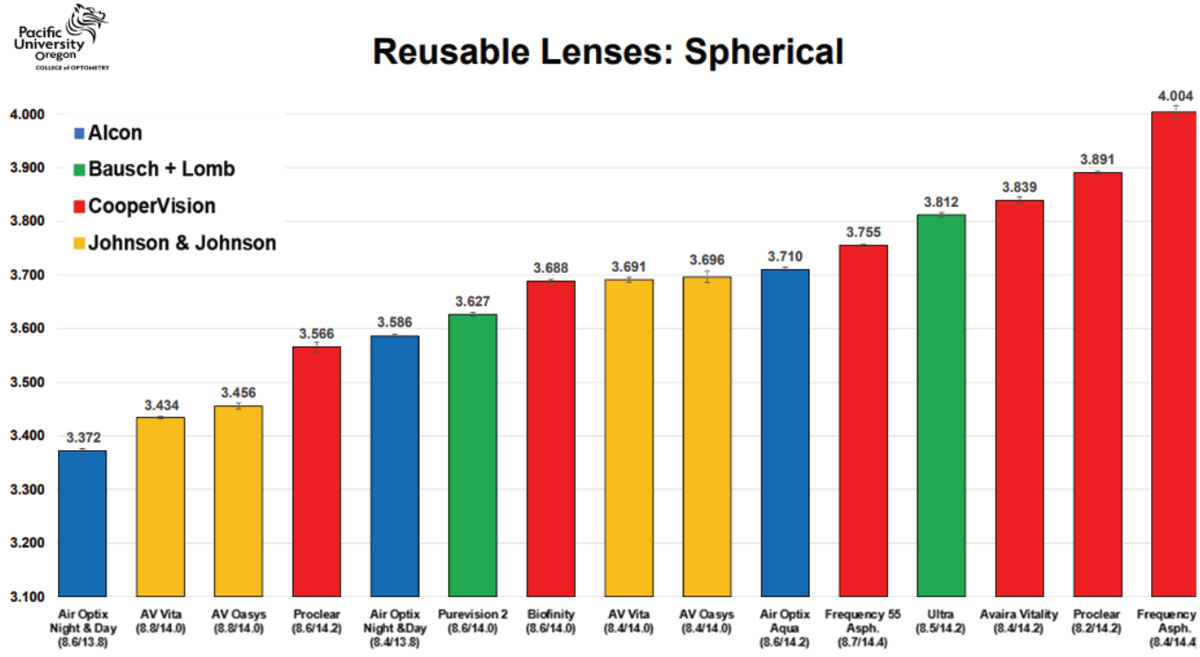
Table 2. Sagittal height reference for reusable spherical soft CLs. Click image to enlarge. |
 |
|
Table 3. Sagittal height reference for toric soft CLs. Click image to enlarge. |
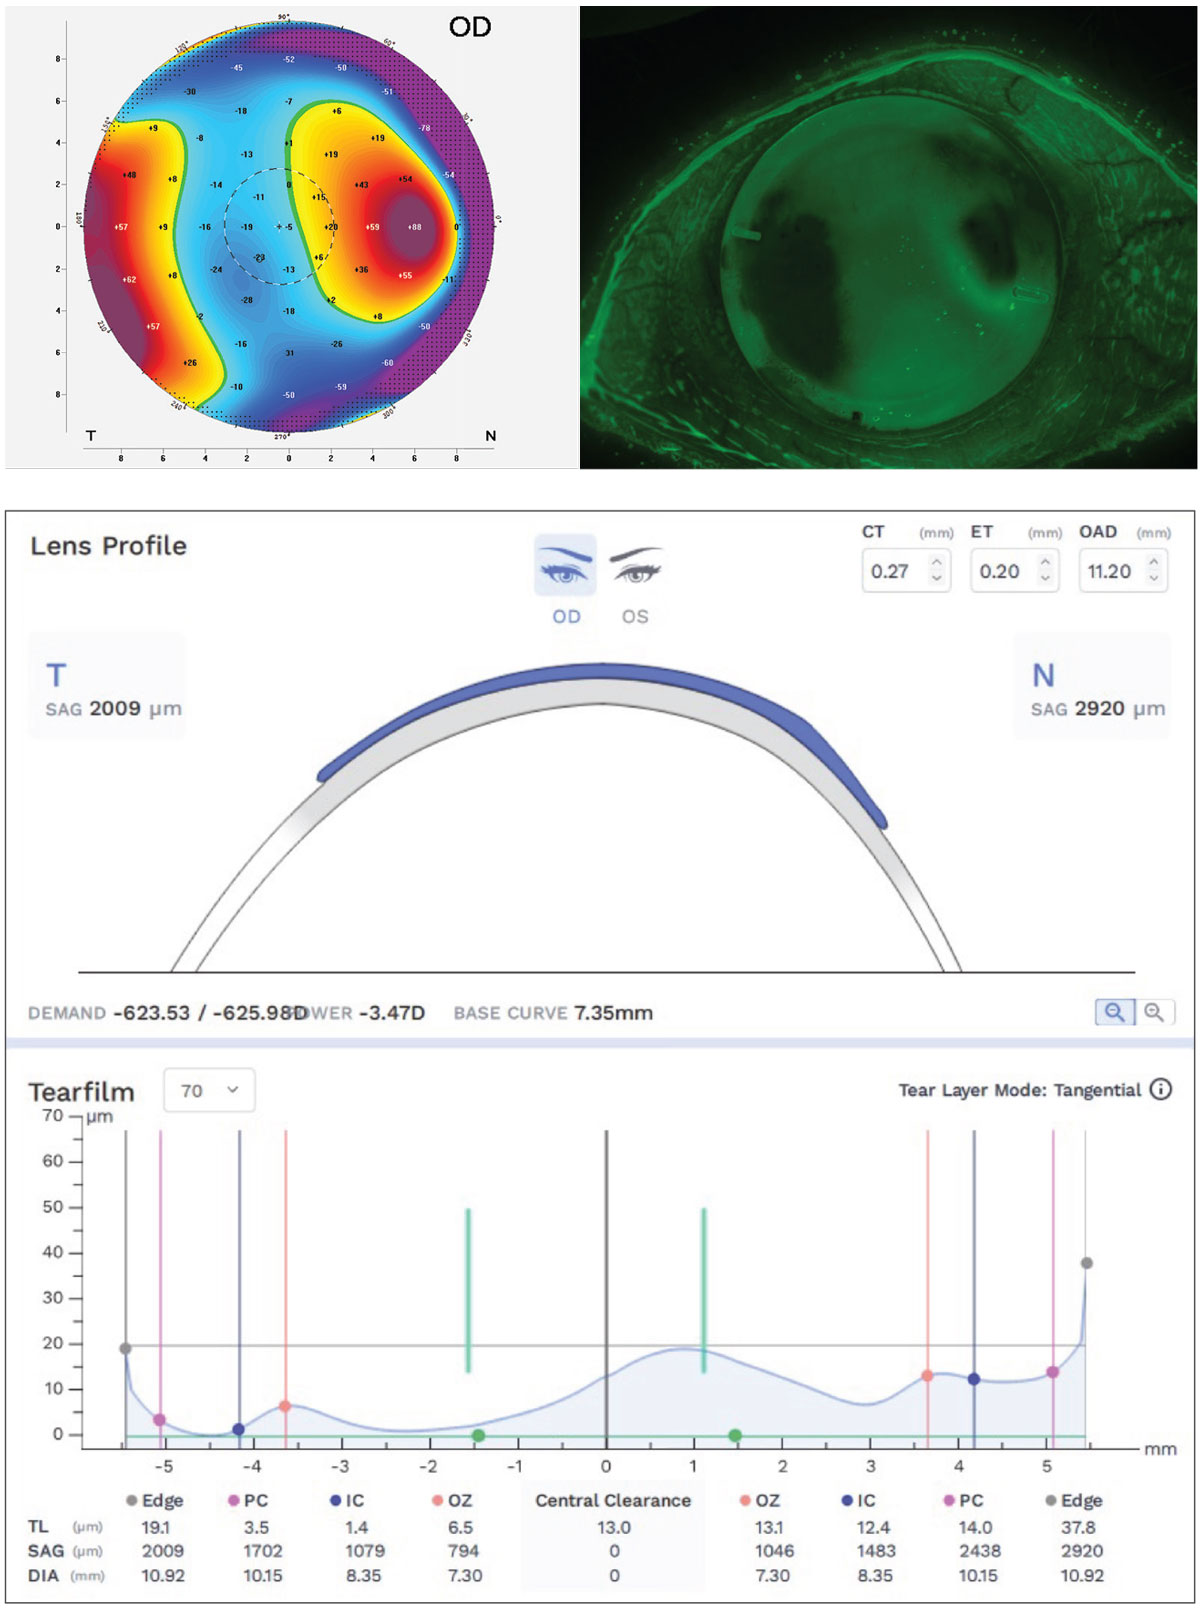
Case 2. This patient has a very spherical, regular cornea with a very average mean K of 43D (Figure 4). Referencing the soft CL sagittal height tables, it is observed that 14.2mm is the most common spherical lens OAD. Using a small-cone Placido disc topographer (Medmont Meridia Pro) and selecting this OAD as the measurement chord, this patient’s estimated corneoscleral SAG is around 3,300µm.4 Although the mean K of 43D is a very typical and average keratometry value for all regular cornea patients, it is likely that selecting an initial lens from the left of the table may provide a superior fit to those listed in the middle or right of the table.
Despite a very average K reading of 43D and that an 8.5mm BC is much more commonly utilized, it is evident based on this eye’s SAG data that, for example, a 9.0/14.3 Acuvue Oasys 1-Day (Johnson & Johnson Vision) would provide a better fit than the more commonly used 8.5/14.3 Acuvue Oasys 1-Day alternative of the same brand. If selecting a monthly reusable soft lens modality, this data would indicate that the Proclear (CooperVision) 8.6/14.2 lens may be a better fit on this patient than the identical parameters of the alternative Air Optix Aqua (Alcon) 8.6/14.2.
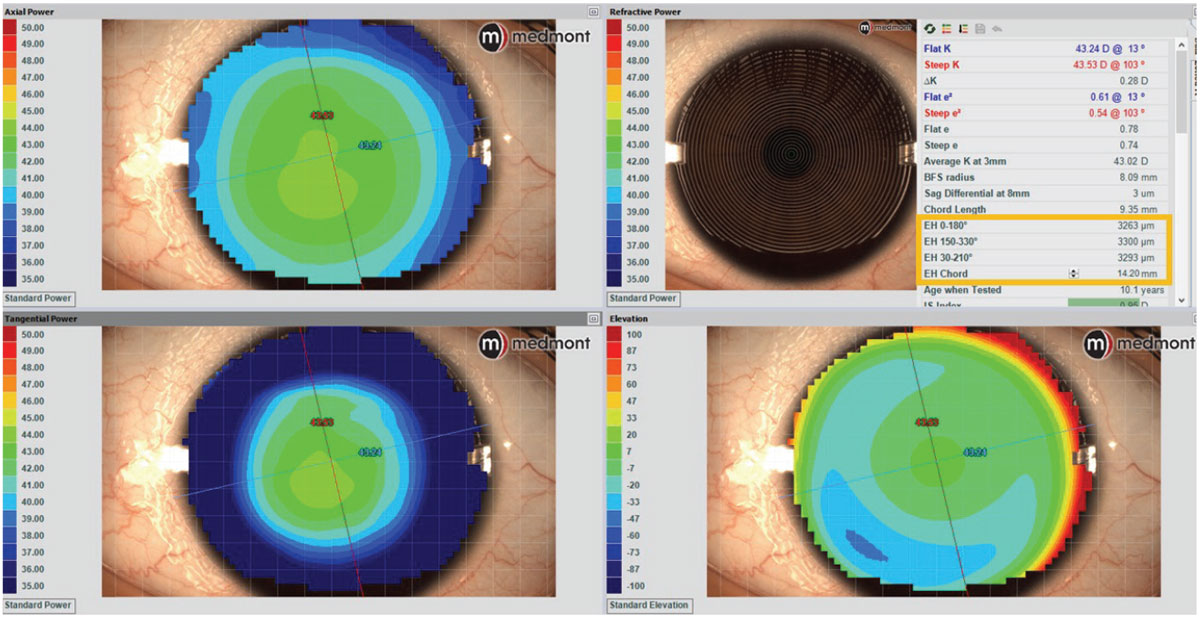 |
Fig. 4. Medmont Placido disc topography with estimated corneoscleral sagittal height data to determine preferred spherical SCL. Click image to enlarge. |
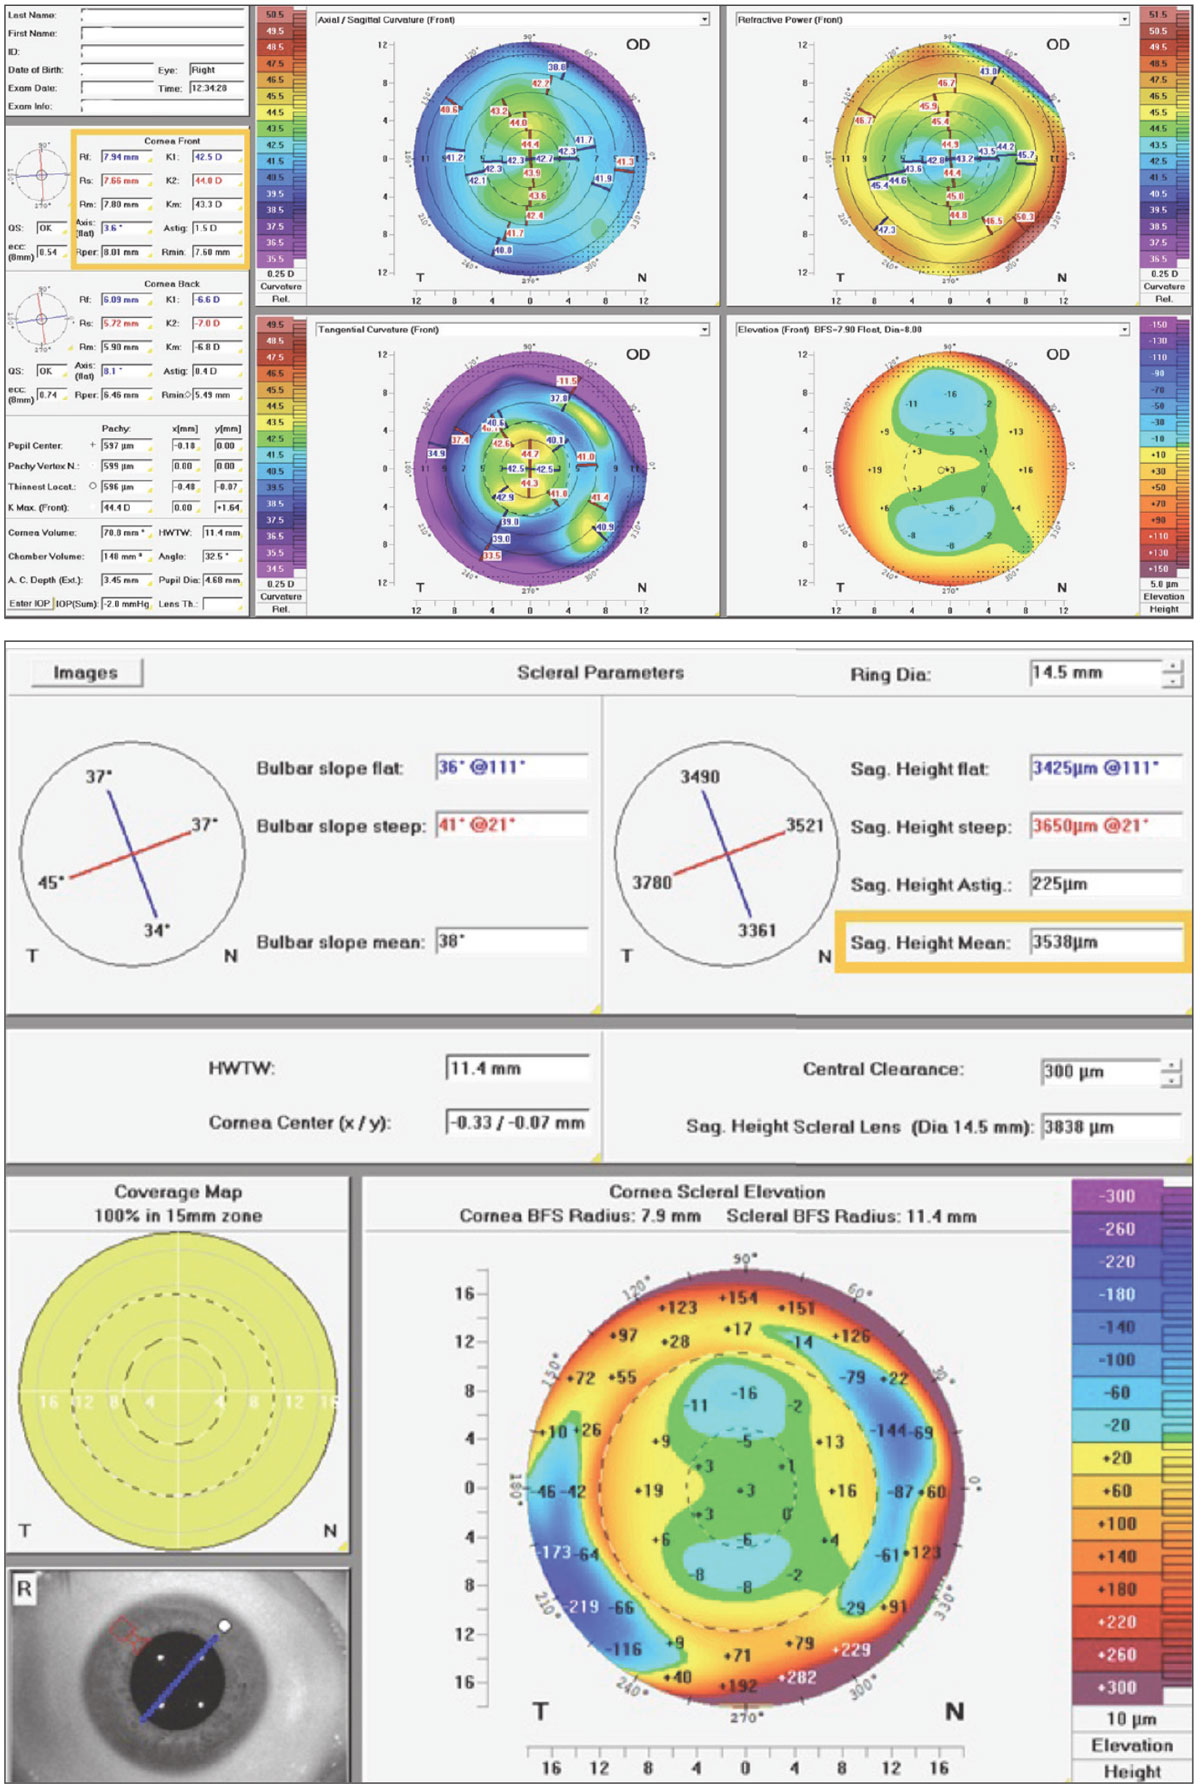
Case 3. This patient also shows a regular cornea with the same mean K of 43D as in Case 2; however, this one is mildly astigmatic, requiring a toric soft lens (Figure 5). For toric soft lenses, 14.5mm is the most common OAD. Using this as the measurement chord with a corneal tomographer (Pentacam AXL Wave) with directly measured corneoscleral topography, this eye’s average SAG is around 3,500µm. This is interesting because despite the typical K of 43D, this patient has a very low ocular SAG compared with most toric options. Referencing the lens tables, even if a practitioner desired a daily disposable toric CL option from the same manufacturer, it is apparent that this eye may be better suited to the 8.6/14.3 Clariti 1-Day Toric (CooperVision) over its similar alternative of the 8.6/14.5 MyDay Toric (CooperVision).
Furthermore, to the keen observer, it can be noted that, although the cornea reveals with-the-rule astigmatism, the sclera conversely reveals against-the-rule astigmatism. This proves that scleral shape and corneal shape do not always correlate and should not be assumed as such.5 This also may be relevant in toric soft lens design, in that some use a prism ballast, where a single quadrant lens thickness weighs the lens into proper orientation, while others opt for a blink-stabilizing design, where instead two opposite edge quadrants are thicker to stabilize the lens between the upper and lower lid. These observations open further interesting questions about which design may be better suited for against-the-rule scleral shapes—questions in which further studies may answer.
 |
|
Fig. 5. Pentacam CSP Pro Scheimpflug tomography with measured corneoscleral sagittal height data to determine preferred toric SCL. Click image to enlarge. |
Some limitations in elevation-driven soft CL fitting include that most practitioners do not use corneoscleral elevation technologies on their soft lens patients, the sagittal height data of commercially available soft lenses are not currently provided by manufacturers and that, because there are so many available soft lens choices, if a lens doesn’t provide good comfort or fit, then it is easy and affordable to simply try multiple others until reaching an acceptable fit.
Sclerals to Align Any Geographical Features
This modality of contact lens has enjoyed a resurgence of interest over the last decade. SLs are primarily sagittal height-focused in their design and fitting due to the goal of the lens to adequately vault over the cornea and land safely and be evenly supported along the sclera.6 Although it has not always been the standard to directly measure corneoscleral sagittal height, it was indirectly determined as an effect of adjusting scleral lens SAG until ideal clearance was achieved. However, with the availability of corneoscleral profilometry mapping today, we can precisely measure the necessary heights at any desired location and accurately visualize the ocular geography, as well as efficiently and empirically design a scleral to fit any eye, regardless of anatomical features.7 Below is one case demonstrating when a scleral lens was the best option.
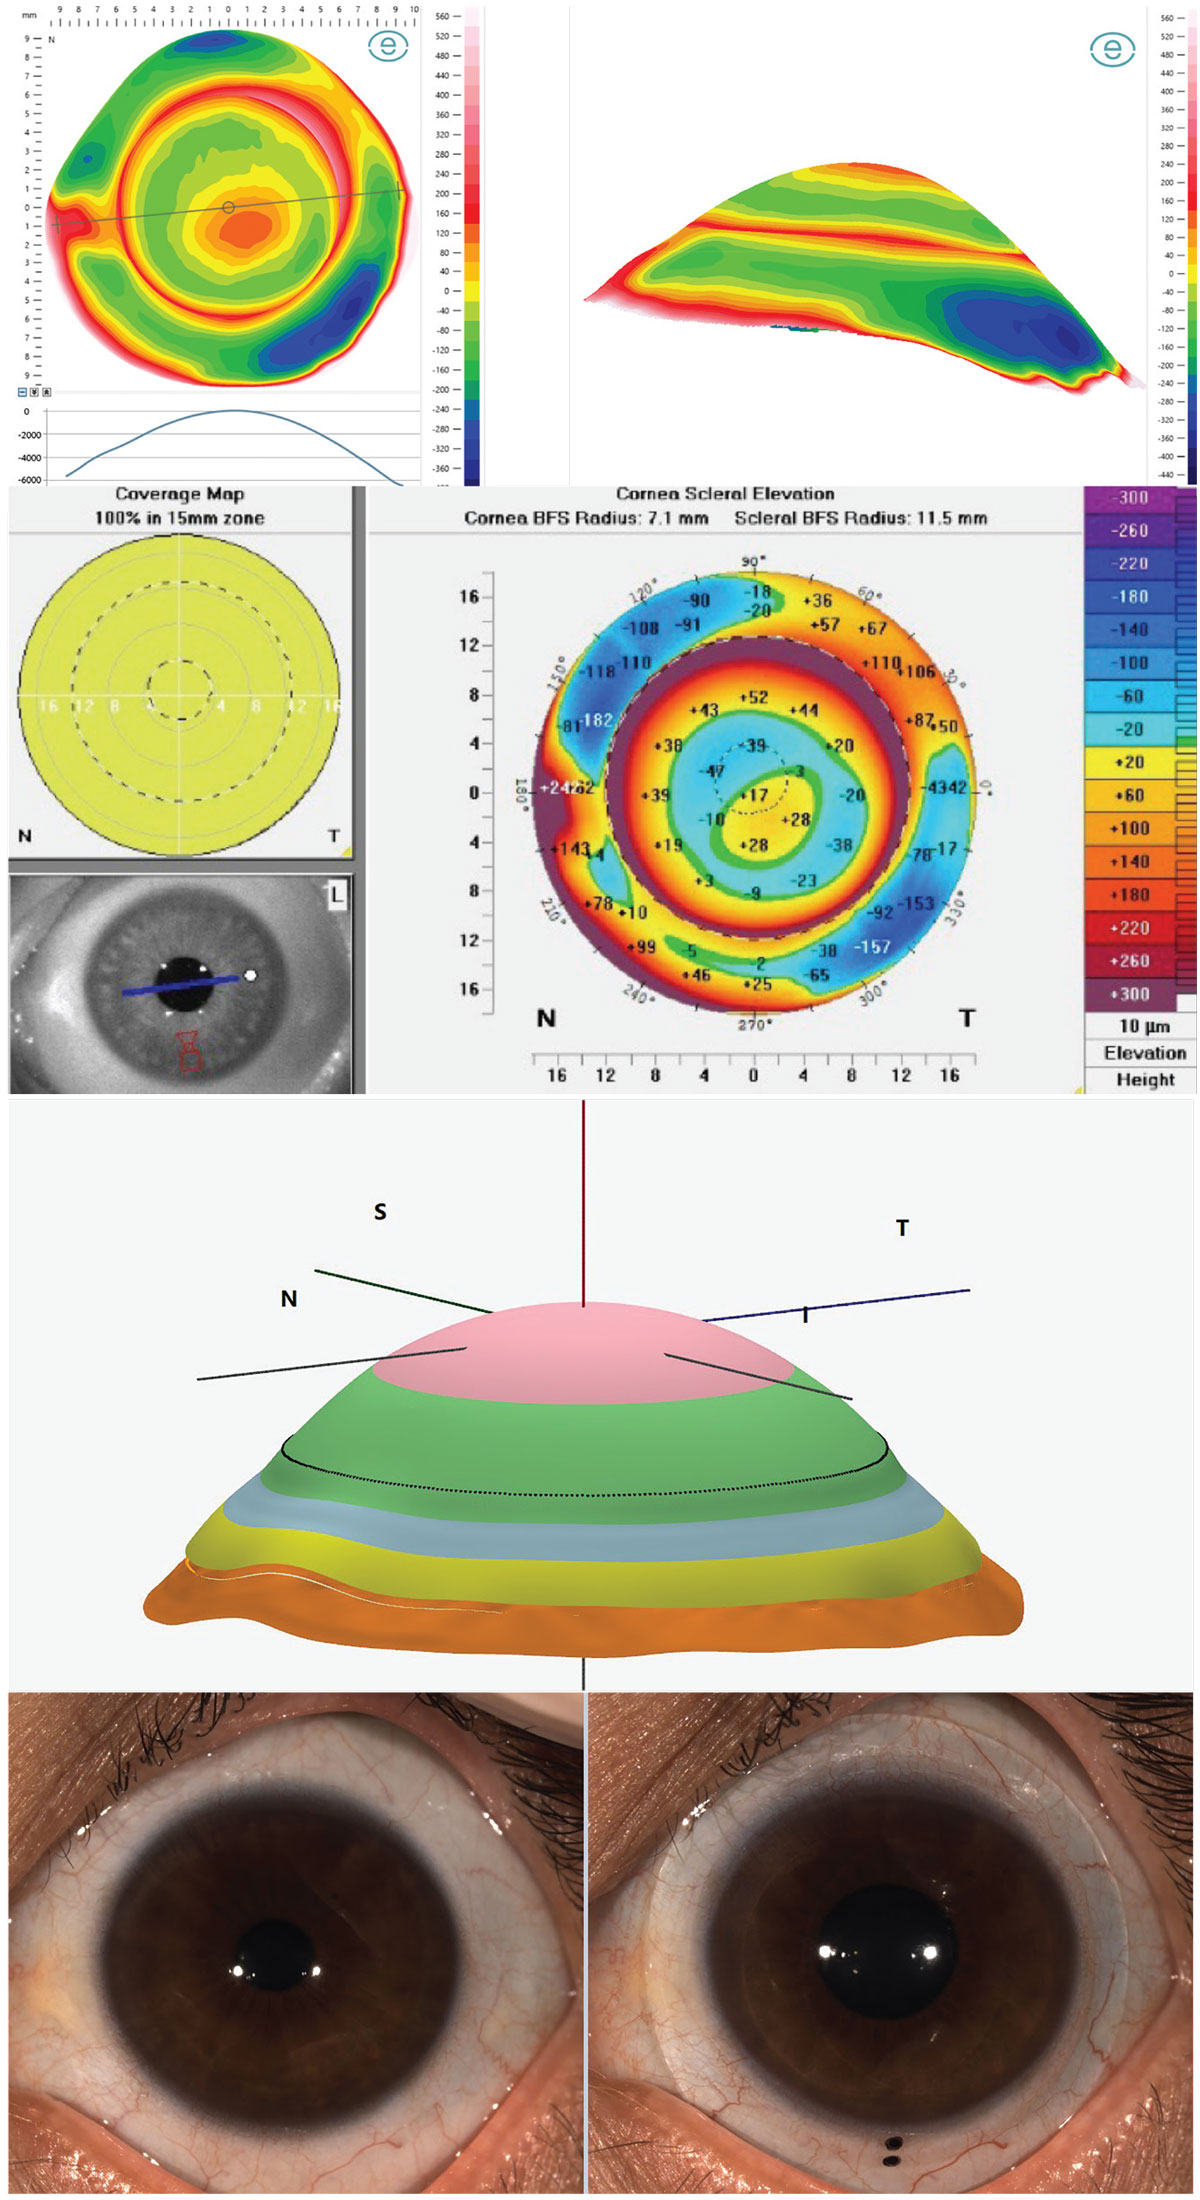
Case 4. This patient has an eye with keratoconus and a raised nasal pinguecula—a geographical challenge encountered often by practitioners. Although cutting out a piece of the lens edge, or notching, around the conjunctival obstacle is an option, it can be difficult to notch precisely and smooth the edges enough to avoid tissue irritation.8 Instead, designing the lens landing zone to precisely follow the precisely measured elevation changes of these obstacles to softly align the ocular surface can be more comfortable for the patient, physiologically gentler and provide better lens rotational stability. Corneoscleral profilometry imaging of the ocular surface by devices such as the Eaglet Eye Surface Profiler or Pentacam AXL Wave may then be exported to CAD/CAM software, EyeXY Gaudi Hypergeometric design software in this case, providing a perfect fit (Figure 6) to the eye’s geographical contours. With corneoscleral profilometry technology, even without CAD/CAM design software, the exact details of the width and height of the obstacle can be provided to lab consultants for a customized edge profile.
 |
|
Fig. 6. Corneoscleral profilometry elevation mapping of the ocular surface with Eaglet Eye Surface Profiler (top left), Pentacam CSP Pro (top right), Gaudi Hypergeometric CAD/CAM design software fit simulation (middle) and the lens in-situ aligning to the sclera and raised pinguecula (bottom). Click image to enlarge. |
Ortho-K: Elevation-based Design Approach
With ortho-K lenses, the industry has seen a shift in both design and parameter nomenclature. For example, some ortho-K manufacturers’ prior curvature-based terms, such as alignment curve, have transitioned more recently to encapsulate changes in the terms of alignment zone or landing zone while reverse curve has changed to return zone and peripheral curve is now called edge lift.9 With these, their prior metrics of associated lens back surface BC are now often noted in SAG values. For many designs, lens landing zone toricity was previously recorded in BC toricity but is now notated in SAG difference at a specified chord.
Today, almost all ortho-K manufacturers and CAD/CAM design software developers have acknowledged the improved intuitiveness of communication in terms of SAG regarding lens parameters and simulated TFT. For example, from anterior corneal elevation data, ortho-K designs from both EyeSpace and WAVE CAD/CAM software show toric ortho-K lens schematics in both total lens SAG metrics and simulated TFT in microns at any point of the lens with interactive software, using elevation data as the primary language of design and simulated fit, rather than curvature metrics of old (Figure 7).
 |
|
Fig. 7. EyeSpace and Wave CAD/CAM ortho-K design software using front corneal elevation data, SAG lens design data and TFT simulation in microns. Click image to enlarge. |
Given the mechanism of ortho-K using fluid dynamic forces in a reverse geometry posterior lens reservoir, precise elevation data is of utmost importance to create the desired reshaping effect of the cornea without creating inappropriate bearing forces or tear exchange seal-off. Even the determination of spherical vs. toric landing zones can be attributed to elevation data. Study findings recommend a toric corneal landing zone when at least 30µm of toricity is present at 8mm.10,11
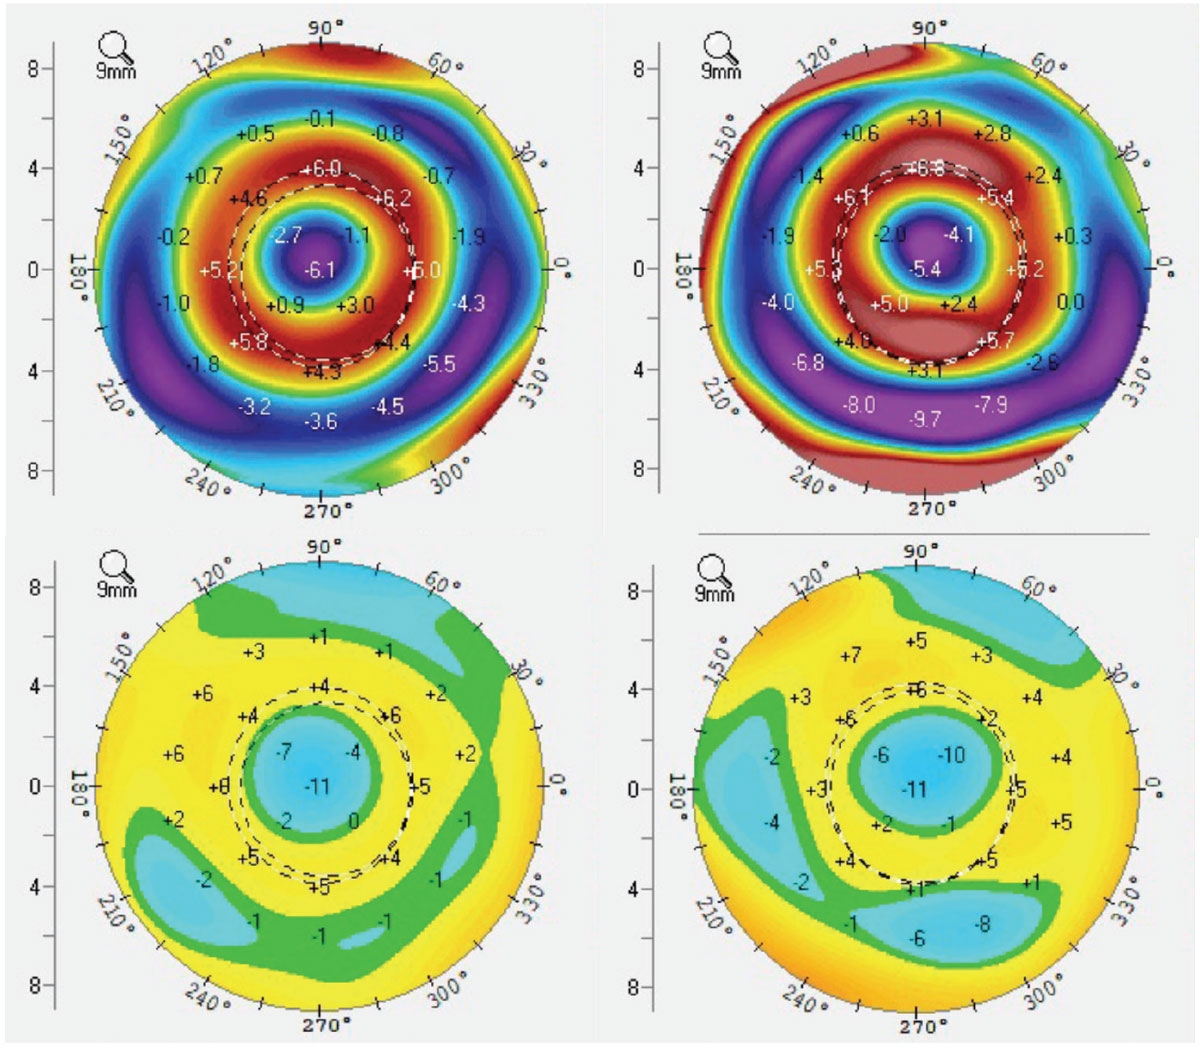
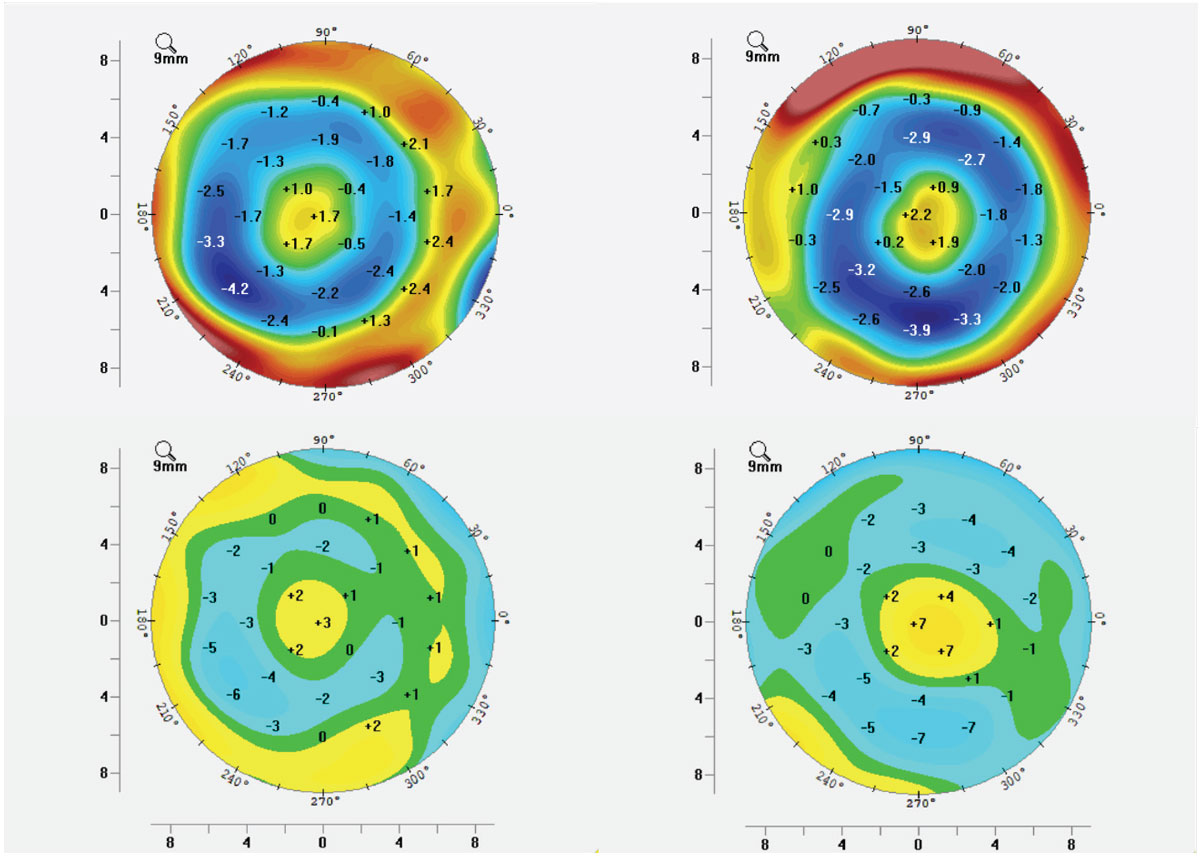
Although the effect of ortho-K treatment has always been measured as the reshaping of corneal curvatures, what is actually happening physically is the compression and expansion of the corneal epithelium to create the desired physiological and optical changes to the cornea (Figures 8 and 9).12 During the topographical review of post ortho-K wear, anterior corneal curvature difference maps, known as subtraction maps or comparison maps, are used to assess the resultant changes to corneal shape and refractive power. This theory of reshaping of the corneal tissue can cause confusion amongst patients and practitioners alike who are unfamiliar with ortho-K because it is often discussed as reshaping the cornea as a whole; in reality, only a few microns of epithelial tissue are being both compressed and expanded to create an optical lens effect out of the epithelium, with a concave effect in myopic ortho-K (MOK) (Figure 8) and an inversely convex effect in hyperopic ortho-K (HOK) (Figure 9).13
 |
|
Fig. 8. MOK tangential (top) and elevation (bottom) difference maps demonstrating both dioptric power changes as well as physical elevation changes to the corneal surface as mapped by Scheimpflug tomography. Click image to enlarge. |
Currently, familiar tangential and axial curvature or power difference maps are used to assess treatment centration, treatment size and evenness of the annular reservoir indicating evenness of fluid dynamic forces—all of which are signs of achieving a great result with ortho-K. However, those refractive and curvature topography findings do not always transfer equally to subjective refractive changes or clinical examination findings.
What is seldom discussed are the elevation difference maps. If it is well understood that the fluid reservoirs are at once flattening the central area while also steepening the mid-peripheral corneal epithelium, how exactly is it doing so? This is where elevation maps may provide a clearer picture for eyecare practitioners. Seen in both Figures 8 and 9 are the physical changes to the epithelium which can be precisely measured and monitored with elevation difference maps.
 |
|
Fig. 9. HOK tangential (top) and elevation (bottom) difference maps demonstrating both dioptric power changes as well as physical elevation changes to the corneal surface as mapped by Scheimpflug tomography. Click image to enlarge. |
With its origins in laser refractive surgery, Munnerlyn’s formula is one that allows us to calculate corneal thickness alterations with how much refractive error can be safely targeted.14 This can be modified to be applicable to ortho-K treatment too, as we can measure with tomography the epithelial layer thickness of each patient. With the understanding of adding the expanded epithelial layer to the compressed epithelial layer for a total depth value, it can be determined for each patient the limits of ortho-K for each eye.
Using topography or tomography elevation difference maps, could it be possible that ortho-K could perhaps be monitored more precisely or repeatably than curvature data? More focus in this area amongst the ortho-K community is needed, but with increasing precision in available diagnostic imaging, elevation difference maps may play an increasing role in ortho-K. Below are two examples.
Case 5. This moderately high myopic patient is undergoing successful corneal MOK. Figure 8 demonstrates ideal topographical difference maps, including elevation difference maps showing total elevation differential within and around the treatment zone of only 15µm to 20µm.
Case 6. This mildly hyperopic and presbyopic patient is undergoing successful translimbal HOK of post-myopic LASIK over-correction. Figure 9 demonstrates ideal topographical difference maps, including elevation difference maps showing total elevation differential within and around the treatment zone of only 10µm to 15µm. Note that the colors of MOK and HOK maps are opposite of each other, as they are changing the corneal characteristics in opposite directions.
Takeaways
Topography is used commonly outside of eye care, but never elsewhere with curvature data to represent those landscapes. You wouldn’t think about the curvature of a shoreline or mountain range, of course, but you would want to know of the height above sea level. That’s because elevation is more intuitive and easier to visualize.
The contact lens industry is evolving, as is our growing understanding of unique fitting characteristics of these various lens modalities available today. A common language is needed between lens design, lens evaluation and lens manufacturing. There is no better language in this industry than sagittal height to bind those aspects together. That’s where the future is headed, if not already there.
Dr. Wolf, FAAO, FSLS, FIAOMC, received his Doctor of Optometry from the University of Houston in 2009. He is the owner of the private practice Austin Optometry Group in Austin, TX, focusing on ocular surface disease and specialty contact lenses, including scleral lenses and orthokeratology. Dr. Wolf provides topography-guided and tomography-guided corneal, scleral and orthokeratology lenses, ocular impression-based lenses and custom HOA-correcting lenses. He is the first doctor in Texas to earn all the following clinical fellowships: Fellow of the American Academy of Optometry, Fellow of the Scleral Lens Society and Fellow of the International Academy of Orthokeratology and Myopia Control. He has served as a speaker, consultant or provided case reports for Eaglet Eye, Medmont Intl., Oculus Wave, Ovitz, EyeXY and Acculens.
1. Ozbek Z, Cohen EJ. Use of intralimbal rigid gas-permeable lenses for pellucid marginal degeneration, keratoconus and after penetrating keratoplasty. Eye Contact Lens. 2006;32(1):33-6. 2. Hashemi H, Yekta A, Shokrollahzadeh F, et al. The distribution of keratometry in a population based study. J Curr Ophthalmol. 2021;33(1):17-22. 3. van der Worp E, Lampa M, Kinoshita B, et al. Variation in sag values in daily disposable, reusable and toric soft contact lenses. Cont Lens Anterior Eye. 2021;44(6):101386. 4. Ritzmann M, Caroline PJ, Börret R, Korszen E. An analysis of anterior scleral shape and its role in the design and fitting of scleral contact lenses. Cont Lens Anterior Eye. 2018;41(2):205-13. 5. Dhaese SE, Kreps EO, Consejo A. Scleral shape and its correlation with corneal parameters in keratoconus. Cont Lens Anterior Eye. 2021;44(4):101366. 6. Barnett M, Courey C, Fadel D, et al. CLEAR - scleral lenses. Cont Lens Anterior Eye. 2021;44(2):270-88. 7. DeNaeyer G, Sanders D, van der Worp E, et al. Qualitative assessment of scleral shape patterns using a new wide field ocular surface elevation topographer: the SSSG Study. J Contact Lens Res Sci. www.jclrs.org/index.php/JCLRS/article/view/11. 2017;1(1):e12-22. Accessed May 26, 2024. 8. Patel RP, Samples JS, Riaz KM. Frugal method of notch modification of scleral contact lenses in the setting of complex ocular surface anatomy. Eye Contact Lens. 2022;48(2):88-90. 9. Bullimore MA, Johnson LA. Overnight orthokeratology. Cont Lens Anterior Eye. 2020;43(4): 322-32. 10. Li Z, Cui D, Long W, et al. Predictive role of paracentral corneal toricity using elevation data for treatment zone decentration during orthokeratology. Curr Eye Res. 2018;43(9):1083-9. 11. Caroline PJ. Contemporary orthokeratology. Cont Lens Anterior Eye. 2001;24(1):41-6. 12. Choo JD, Caroline PJ, Harlin DD, Papas EB, Holden BA. Morphologic changes in cat epithelium following continuous wear of orthokeratology lenses: a pilot study. Cont Lens Anterior Eye. 2008;31(1):29-37. 13. Haque S, Fonn D, Simpson T, Jones L. Corneal and epithelial thickness changes after 4 weeks of overnight corneal refractive therapy lens wear, measured with optical coherence tomography. Eye Contact Lens. 2004;30(4):189-93;discussion 205-6. 14. Kim WK, Kim BJ, Ryu IH, Kim JK, Kim SW. Corneal epithelial and stromal thickness changes in myopic orthokeratology and their relationship with refractive change. PLoS One. 2018;13(9):e0203652. |